A while back, one of our worker services started getting throttled. It picks up jobs and, for each one, calls a third-party API over HTTPS on the public internet. It ran as four ECS tasks of 4 vCPU and 8 GiB. Latency was fine, since nothing waits on a worker, but the throttling metrics were all over the place.
What fixed it wasn’t a change to what the service did. Its HTTP client had been running with Go’s default of 2 idle connections per host. A change to how we build that client raised it to 1,024, and the throttling settled. The service hadn’t needed more CPU. It had needed to stop opening connections.
Most advice about Go’s HTTP client stops at “reuse your http.Client”. The number that mattered here is one almost nobody changes: 2.
This post follows a request through net/http’s connection pool, looks at what that number does, and measures what it costs, from one request up to a caller that collapses. The code for every experiment is in http-pool-lab.
One request, start to finish#
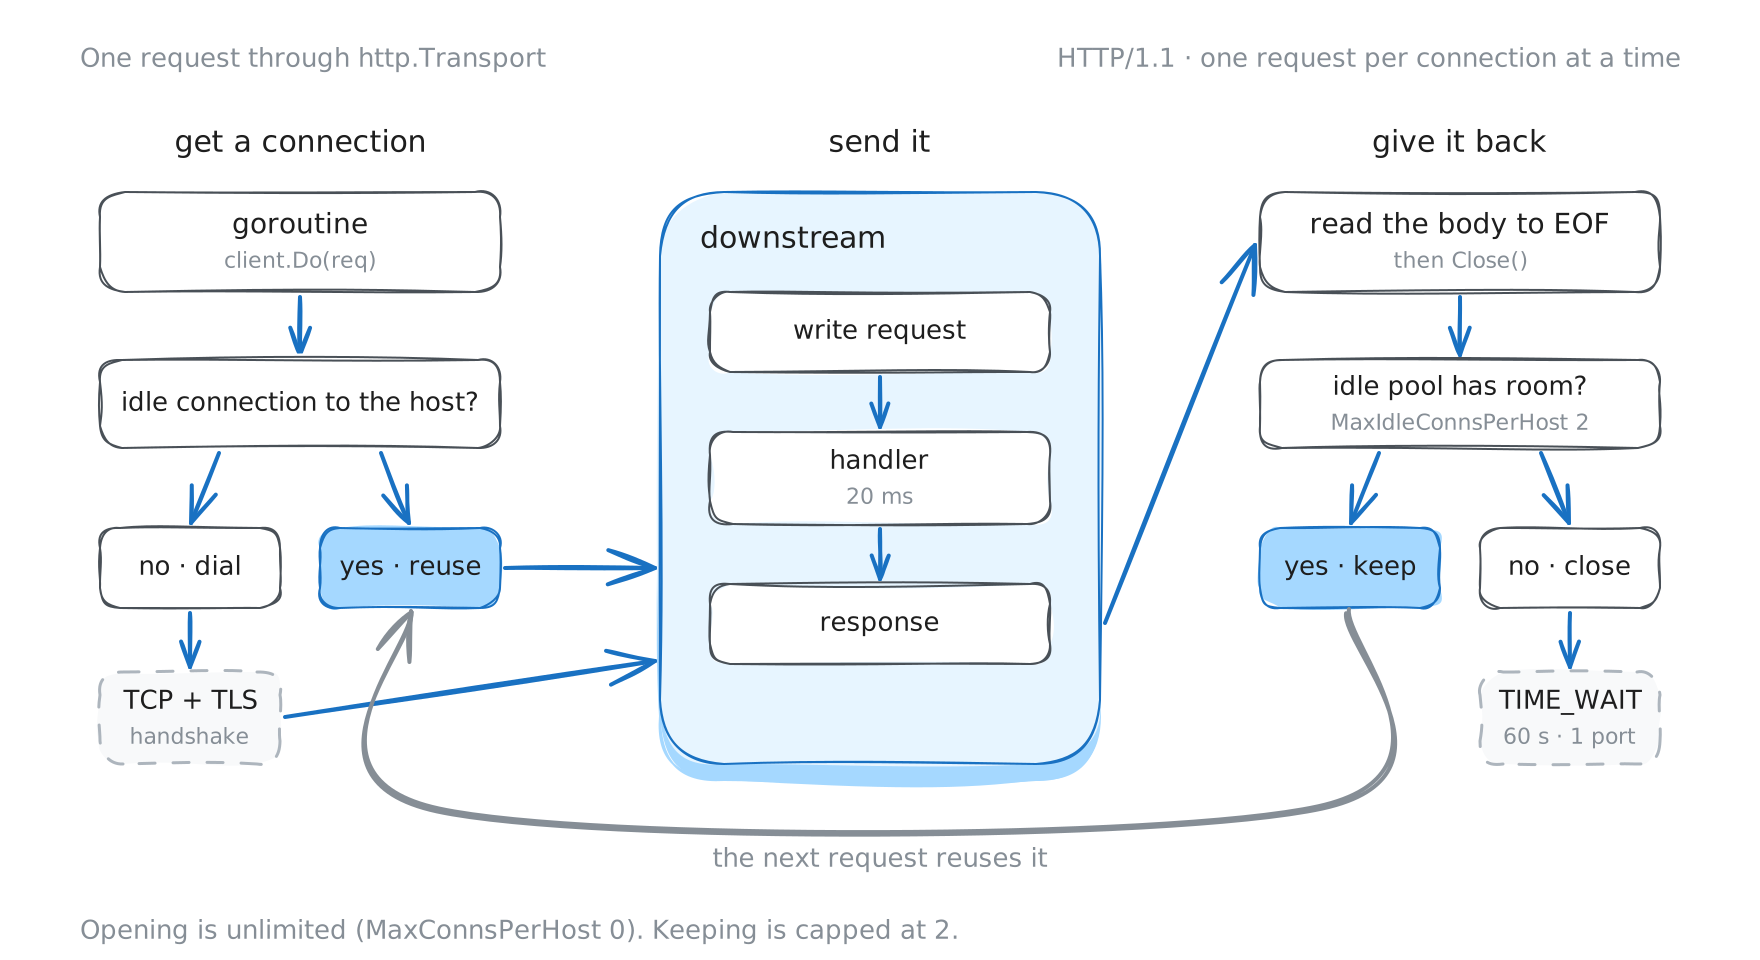
When you call client.Do, the http.Client hands the request to its Transport. The transport finds a connection to the host, writes the request on it, and gives you the response. When you’ve read the body to the end and closed it, the transport takes the connection back for the next request.
Two things decide what happens to your latency and your CPU: how the transport finds a connection, and what it does with one when you’re finished.
Getting a connection: two queues, again#
If you read the MongoDB post, this will look familiar. That driver borrowed its pool design from net/http.
The transport first looks for an idle connection to the host. If there is one, you get it immediately. If there isn’t, your goroutine waits on two things at once: a connection that another request is about to return, and a brand-new connection, which the transport starts dialling for you straight away. Whichever arrives first wins.
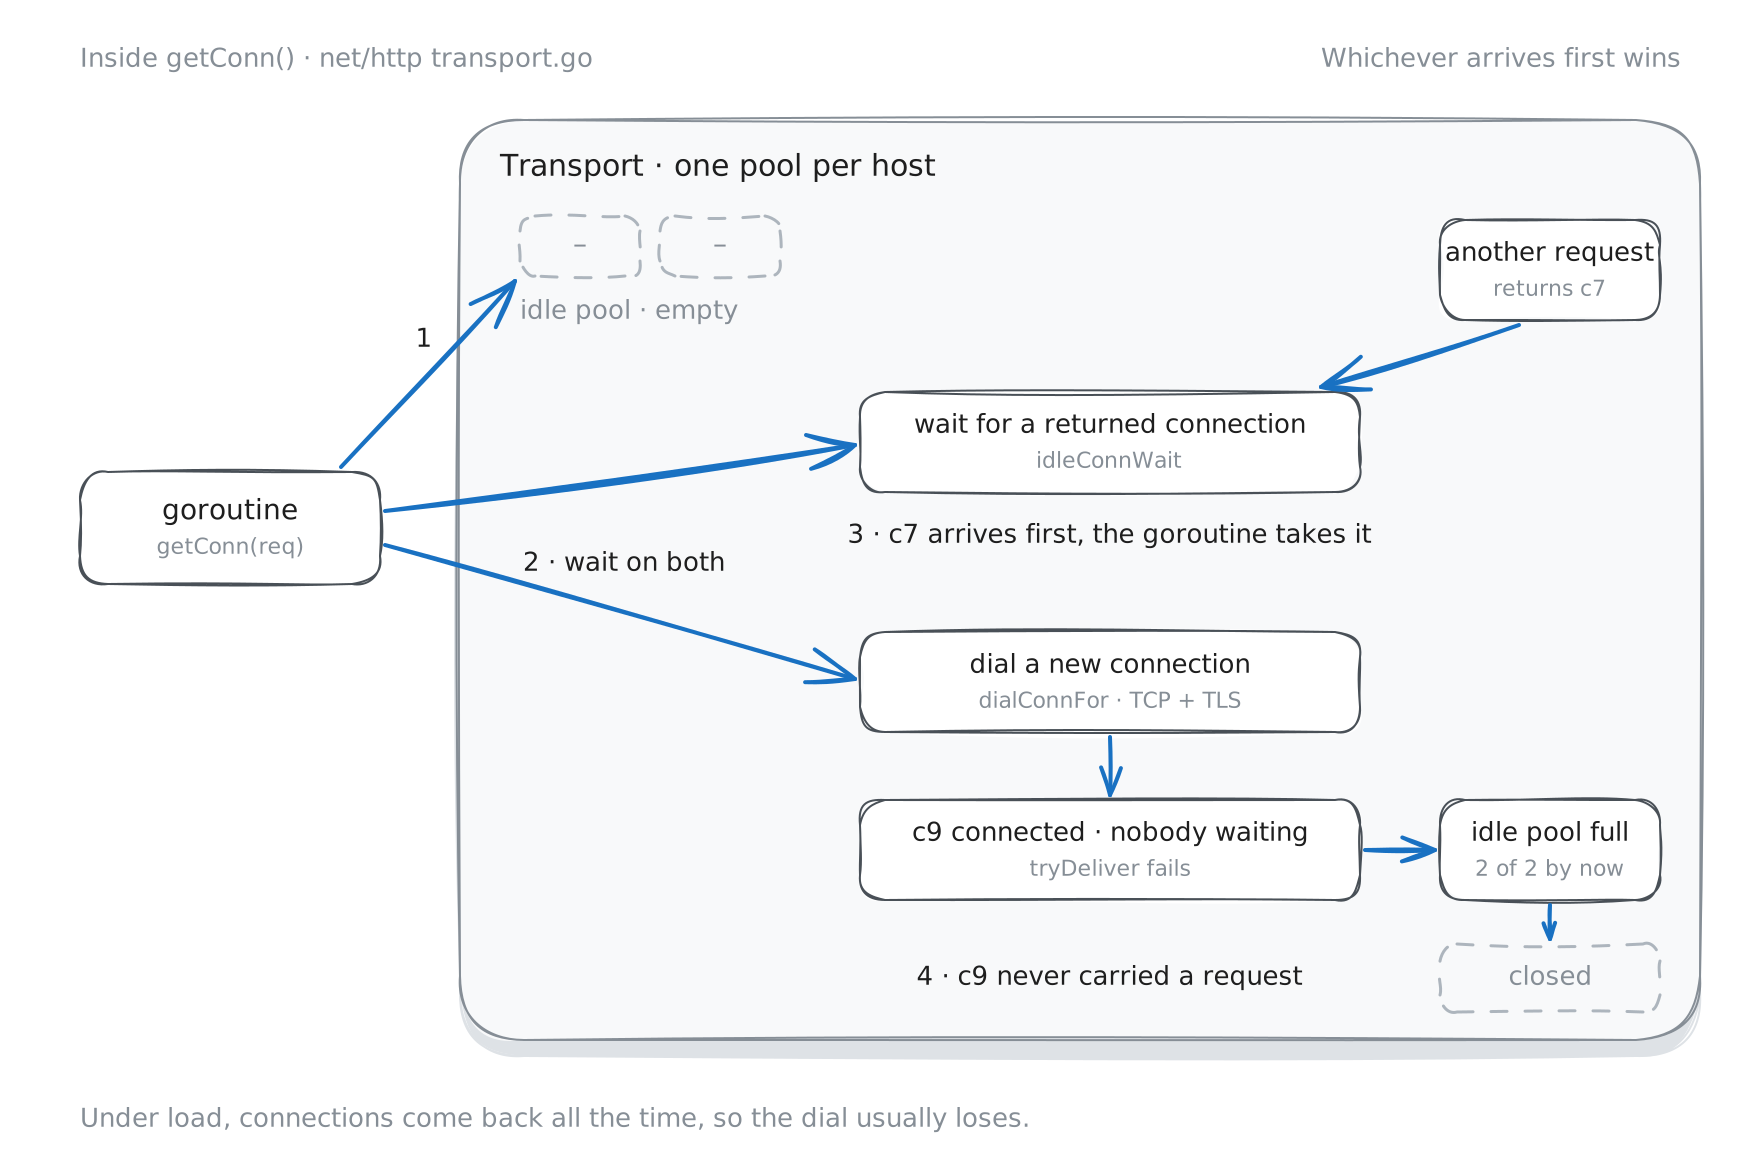
getConn: an idle connection if there is one, otherwise a race between a returned connection and a new dial.Here’s the part that matters: http.DefaultTransport puts no limit on how many connections it opens to a host. MaxConnsPerHost is 0, which means unlimited. So in the default setup, a request never waits in line for a connection. If none is free, it dials one.
That sounds like the generous choice, and it is, until you look at what happens when the requests finish.
Giving it back: the number 2#
When you close a response body, the transport tries to put the connection back in its idle pool. The pool keeps at most MaxIdleConnsPerHost connections per host, and in DefaultTransport that’s DefaultMaxIdleConnsPerHost, which is 2.
If the pool already has two, the connection is closed.
Put the two halves together. Opening is unlimited and keeping is capped at two. So as soon as more than two requests to the same host are in flight at once, every extra connection is opened, used once, and thrown away.
How many requests are in flight at once is arrival rate times latency, which is Little’s law. Against a downstream that takes 20 ms, it only takes 100 requests a second to have more than two in flight, and most services that call other services sit far above that. Try your own numbers:
in flight = rate × latency
/s × ms = in flight
To see it, I sent requests to a server that takes 20 ms each, at rates from 50 to 3,200 a second, once with DefaultTransport and once with MaxIdleConnsPerHost raised to 128.
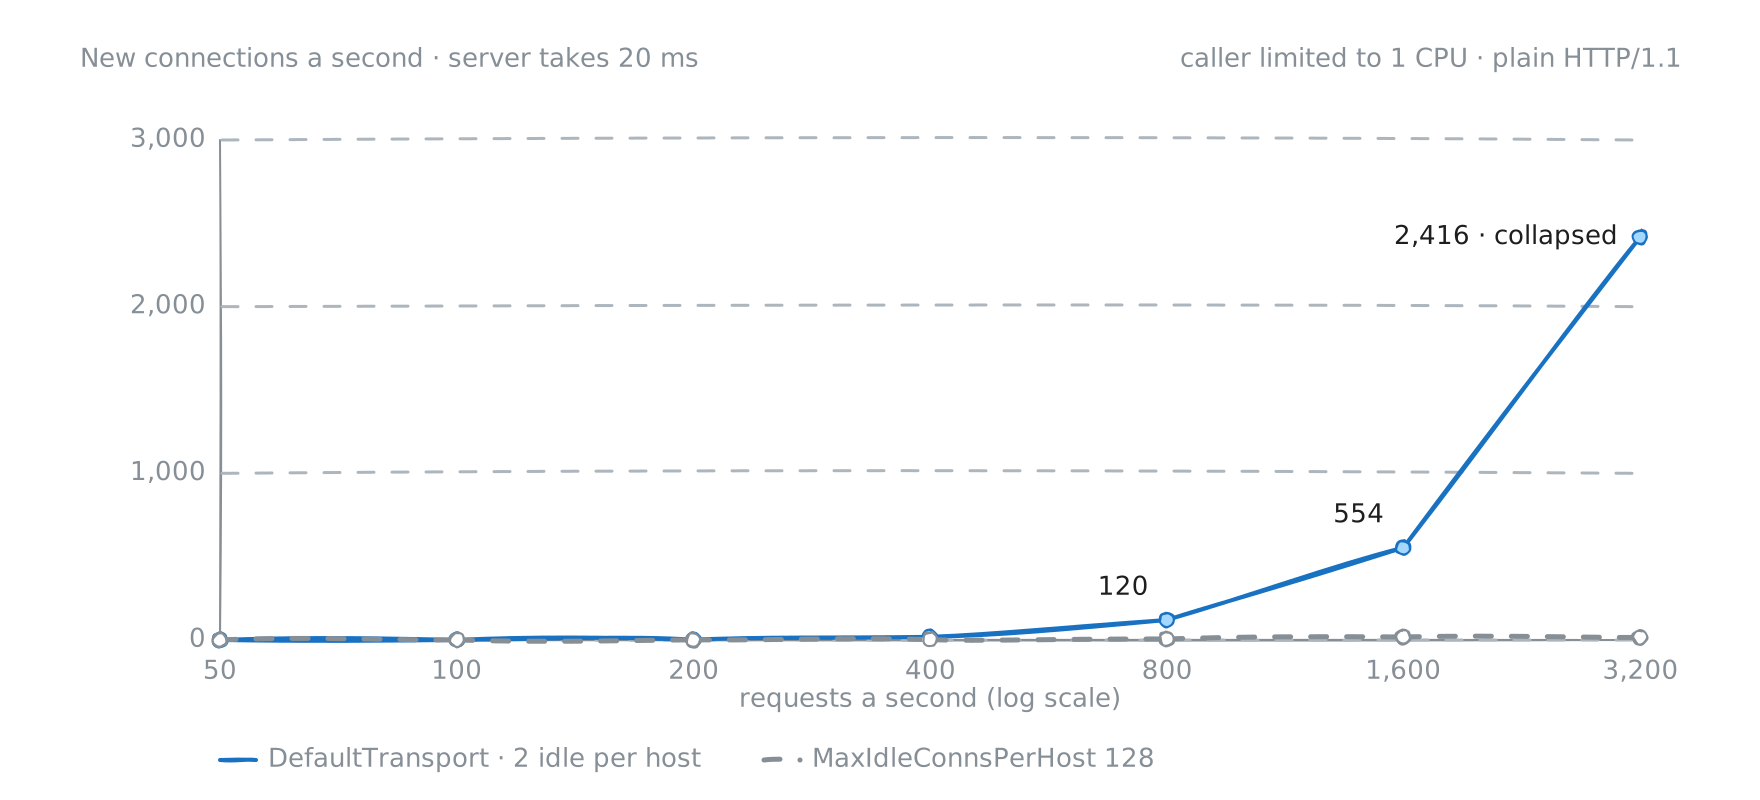
At 200 requests a second the default transport opened about one connection a second. At 800 it opened about 120, and at 1,600 it opened about 550 a second (526 to 580 across three runs), every one of them closed again within milliseconds. With 128 idle connections allowed, the same 1,600 requests a second opened fewer than 35.
The connection nobody used#
There’s a second effect, and I didn’t expect it.
Remember the race in figure 2. A goroutine that finds no idle connection starts a dial, and also waits for a returned one. Under load, connections are being returned all the time, so the returned one usually wins. The goroutine takes it and goes on its way.
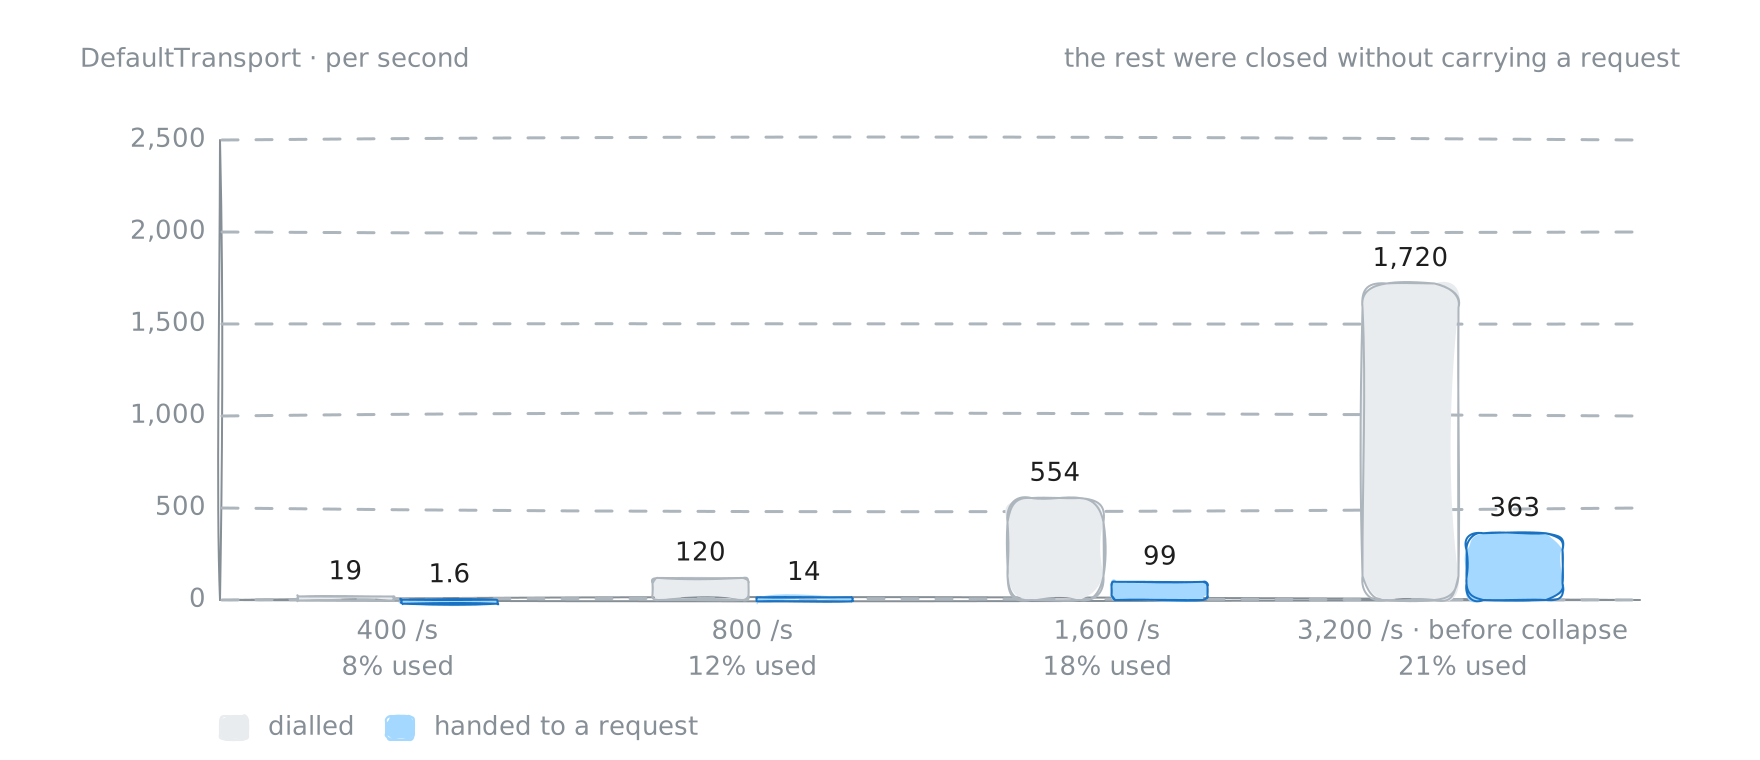
The dial doesn’t stop. It finishes, and the new connection has nobody to deliver to, so the transport tries to put it in the idle pool (dialConnFor). The pool already has its two, so the connection is closed. It carried no requests at all.
At 3,200 requests a second, in the seconds before things went wrong, the default transport opened about 1,720 connections a second. Only about 360 of them were ever given to a request. The rest were dialled, never used, and closed.
What a new connection costs#
Each of those connections costs a TCP handshake, and if you use TLS, a TLS handshake on top. To price them, I sent the same 500 requests a second twice: once on warm connections, and once with keep-alive turned off, so every request opened a new one.
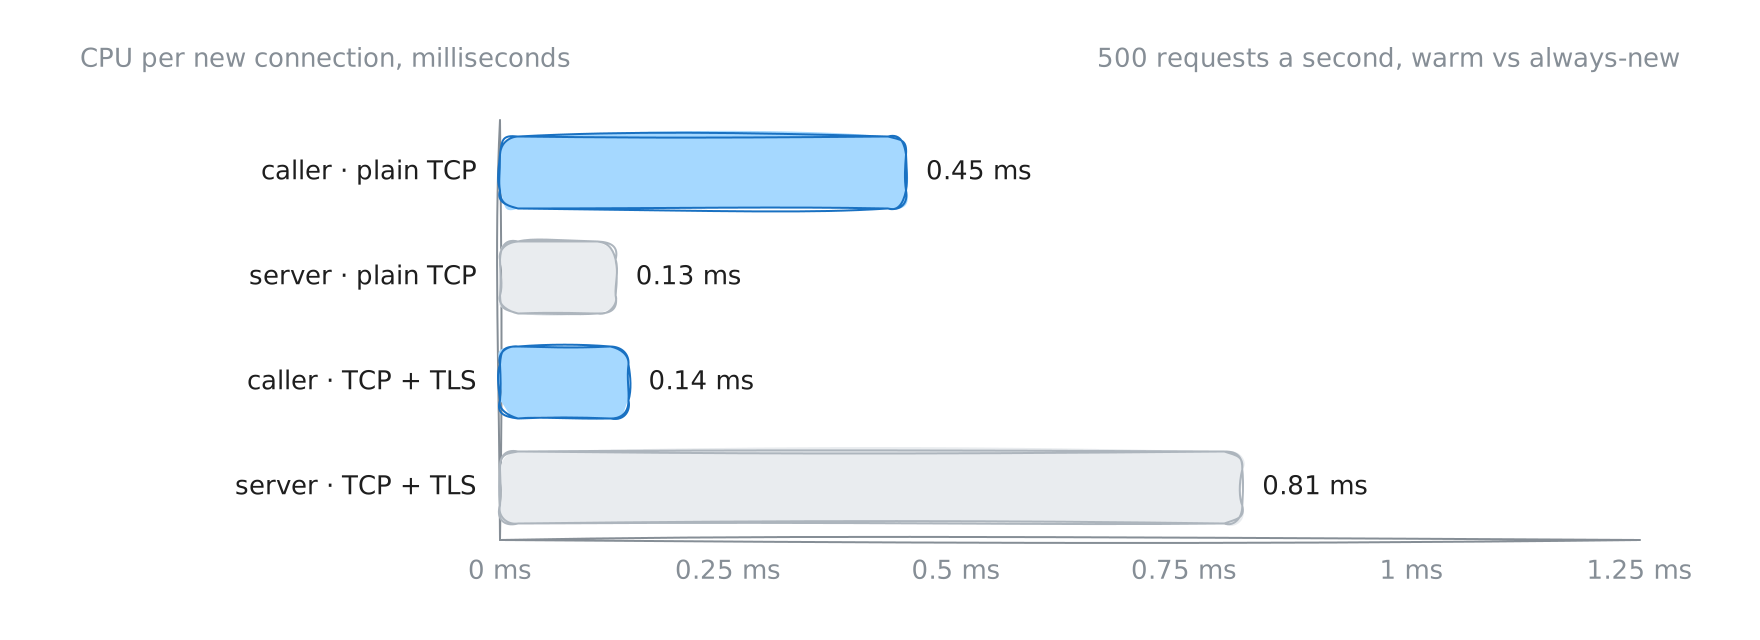
With TLS and an RSA 2048 certificate, new connections took the server from 0.21 to 0.62 cores. Most of a TLS handshake’s cost lands on the side that signs, and that’s the server.
CPU per handshake = extra cores ÷ handshakes a second
(0.62 − 0.21) cores ÷ 500 /s ≈ 0.8 ms
The other cost is what a closed connection leaves behind. Whoever closes a TCP connection first holds it in TIME_WAIT for 60 seconds on Linux, and each one occupies an ephemeral port. Linux’s default range has 28,232 of them, and to a single destination that sets a ceiling:
sustained new connections ≤ ephemeral ports ÷ TIME_WAIT
28,232 ÷ 60 s ≈ 470 a second
To one destination address and port, from the side that closes first.
With the default transport closing connections on the caller side, the caller held 10,500 to 11,600 of them after 20 seconds at 1,600 requests a second. Those runs closed 526 to 580 a second, which is over the ceiling: kept up for a minute, they would run out of ports.
The body you didn’t read#
A connection only goes back to the pool if you read the body to the end before closing it. Close it early and the transport has no way to know where the next response starts, so it closes the connection.
I ran 400 requests a second with a 64 KB body, reading it to the end in one run and just closing it in the other.
| reused | new connections/s | caller CPU | |
|---|---|---|---|
| read to the end | 99.8% | 1 | 0.20 cores |
| closed unread | 0% | 400 | 0.40 cores |
Every request opened a new connection, and caller CPU doubled. If you return early on a status code, drain the body first: io.Copy(io.Discard, resp.Body).
Why HTTP/2 hides all of this#
Over TLS, DefaultTransport negotiates HTTP/2 when the server supports it (ForceAttemptHTTP2 is true), and HTTP/2 carries many requests on one connection at once. None of the above applies.
At 800 requests a second over TLS, DefaultTransport used one connection for the whole run. A bare &http.Transport{} with a TLS config, which is what a lot of code builds, doesn’t set ForceAttemptHTTP2. It fell back to HTTP/1.1 and opened 167 connections a second, and the server’s CPU went from 0.26 to 0.43 cores doing handshakes.
So if your calls go over TLS with DefaultTransport, you’re probably fine. Most service-to-service calls don’t. They’re plain HTTP inside a VPC, or behind a load balancer that speaks HTTP/1.1 to targets, or they use a custom transport.
When it all lands on one CPU#
Each cost so far is small on its own. The trouble starts when they share a CPU limit.
A container’s CPU limit is enforced in 100 ms periods. Use up the period’s quota and every thread in the container stops until the next one.
CPU time per period = CPU limit × period
1 CPU × 100 ms = 100 ms, shared by every thread. Two busy threads spend it in 50 ms.
I’ll write about that separately; for this post, what matters is that a throttled caller holds every in-flight request longer, and in this transport, more in-flight requests means more connections.
Here’s the default transport at 3,200 requests a second, plain HTTP, on a caller limited to one CPU:
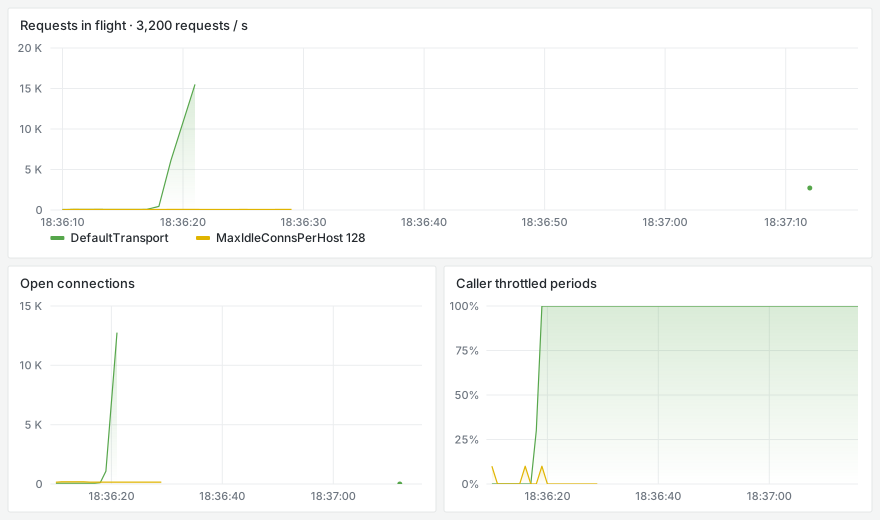
For eight seconds it held steady: about 70 requests in flight, 0.6 to 0.7 cores, no throttling. Then the caller hit its quota. Requests slowed down, so more were in flight. Every request that arrived with no idle connection started a new dial. More dials meant more CPU, which meant more throttling. In-flight requests went from 70 to 449, then to 6,117, then past 15,000. Open connections reached 12,758, and the caller was throttled in 87% of its periods for the rest of the run. p99 latency was 41 seconds. All three runs went the same way: 87 to 88% of periods throttled, and p99 between 41 and 53 seconds.
The same traffic with 128 idle connections per host used 0.49 to 0.60 cores, throttled in 1 to 1.5% of periods, and kept p99 between 24 and 33 ms.
Back to the incident#
I rebuilt the shape of ours: a caller limited to one CPU, calling one downstream over HTTP/1.1 with a 100 ms deadline, through a burst from 1,200 to 2,400 requests a second and back.
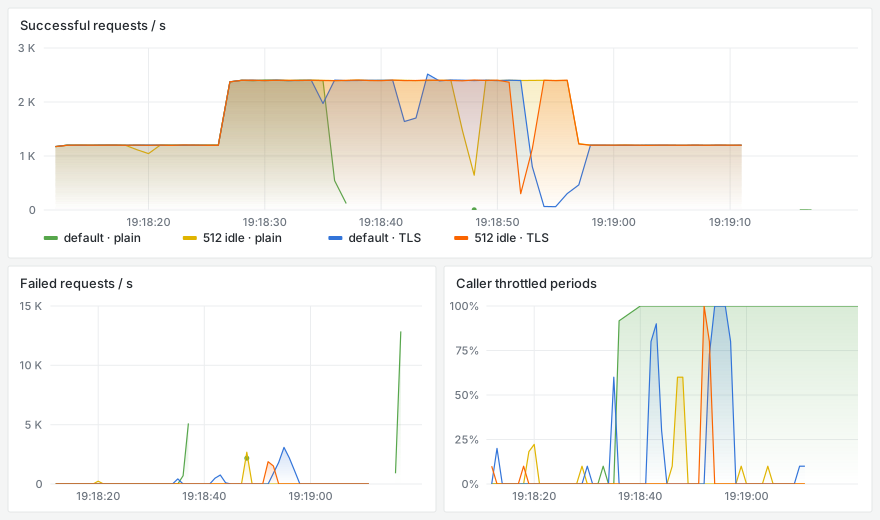
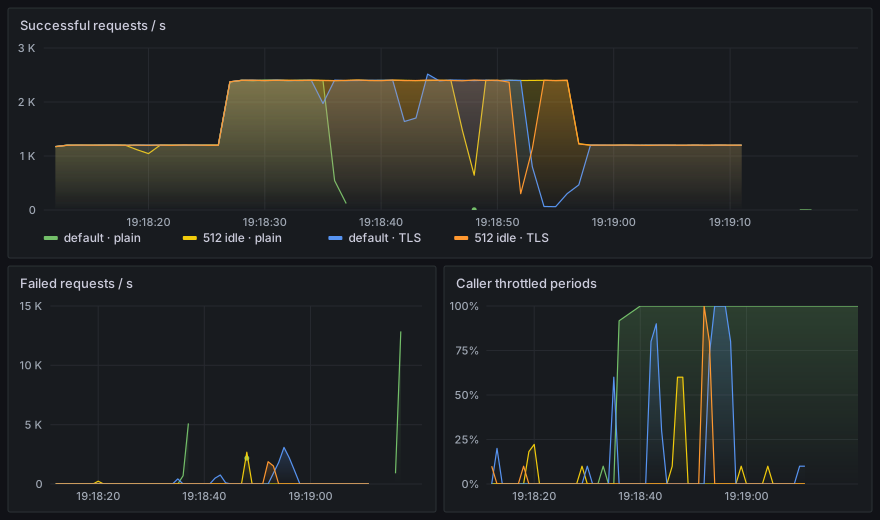
On plain HTTP the default transport held for about ten seconds, then went the way of the 3,200 a second run, in all three runs: 66 to 77% of periods throttled, around 68,000 timeouts, and no recovery after the burst. With 512 idle per host it stayed at 0.7 to 3.3%. Over TLS the default transport held, with 0.8 to 13% of periods throttled depending on the run.
The difference between the two is TIME_WAIT. On plain HTTP the caller closes the surplus connections itself, so it holds each one for 60 seconds; during the burst that reached 25,000 to 28,000 of its 28,232 ports. Over TLS it held almost none. Setting net.ipv4.tcp_tw_reuse=1 on the caller, which lets the kernel reuse those ports for new connections, removed the plain-HTTP collapse in all three runs: 0.3 to 0.7% of periods throttled. Widening the port range to 1024–65535 only softened it, to 55 to 58%, because the bigger range filled up too.
Deadlines feed the churn. On HTTP/1.1, a request cancelled mid-flight takes its connection with it, so a burst of timeouts is followed by a burst of dials: in one run, about 1,900 timeouts at the end of the burst were followed by 1,293 new connections in the next second, with 512 idle allowed.
What I’d set#
| Setting | What I’d do | Why |
|---|---|---|
http.Client | one per downstream, shared by every goroutine | each Transport has its own pool |
MaxIdleConnsPerHost | about your peak in-flight requests to that host: rate × latency, with headroom | the default of 2 closes everything above two in flight |
MaxIdleConns | at least MaxIdleConnsPerHost × hosts | DefaultTransport’s 100 is across all hosts and caps the per-host setting |
MaxConnsPerHost | leave at 0 unless the downstream needs protecting | it’s the one setting that makes requests queue for a connection |
IdleConnTimeout | shorter than the server’s or load balancer’s idle timeout | so the caller, not the server, closes idle connections |
| Custom transports | start from http.DefaultTransport.(*http.Transport).Clone() | &http.Transport{} loses ForceAttemptHTTP2, timeouts and limits |
| Response bodies | read to EOF before closing, even on errors | otherwise the connection can’t be reused |
| Metrics | count GotConn with Reused false via httptrace | new connections a second is the number to alert on, not CPU |
How this was measured#
Everything above comes from http-pool-lab, and every number is in its results summary.
- Two containers. A Go server that sleeps for a configurable delay, on plain HTTP and TLS (RSA 2048), and a caller limited to one CPU with a CFS quota, the same mechanism as an ECS task’s
cpu. Go 1.25, which setGOMAXPROCSto 2. - Open-loop load. Requests go out on a schedule whether or not earlier ones have finished, the way real traffic arrives.
- Per-request traces from
net/http/httptrace: time to get a connection, whether it was reused, and connect and TLS time. - Both sides’ cgroup
cpu.stat, the caller’s every 10 ms, and TIME_WAIT counts from/proc/net/tcp.