A while back, the CPU on one of our MongoDB primaries went to 100%, and it took the fix to make me realise I didn’t understand why.
Nothing exotic had happened. Traffic went up, which is normal. Our Go services had small connection pools, requests started stacking up inside them, and then the database fell over. We kept more idle connections open, and the problem went away. Steady-state CPU went up a little after that, and everything was healthier than before.
So we added connections, the database did more work, and it got better. Most advice on this boils down to “tune maxPoolSize”, which treats the pool like a throughput dial. That advice couldn’t explain what we saw, because the pool isn’t a throughput dial. It decides where your requests wait.
This post follows a single FindOne from the goroutine that calls it to the storage engine and back, and looks at every place along the way where it can sit doing nothing. Most of it comes from reading the Go driver’s source and mongod’s, with a small experiment next to each idea. By the end you should be able to explain our incident yourself. I’ll do it too, at the end, and it didn’t go the way I expected.
Everything here is MongoDB 8.0 and the official Go driver. The experiments ran against a mongod pinned to two CPUs in Docker, and the code for all of them is in mongo-pool-lab.
One request, start to finish#
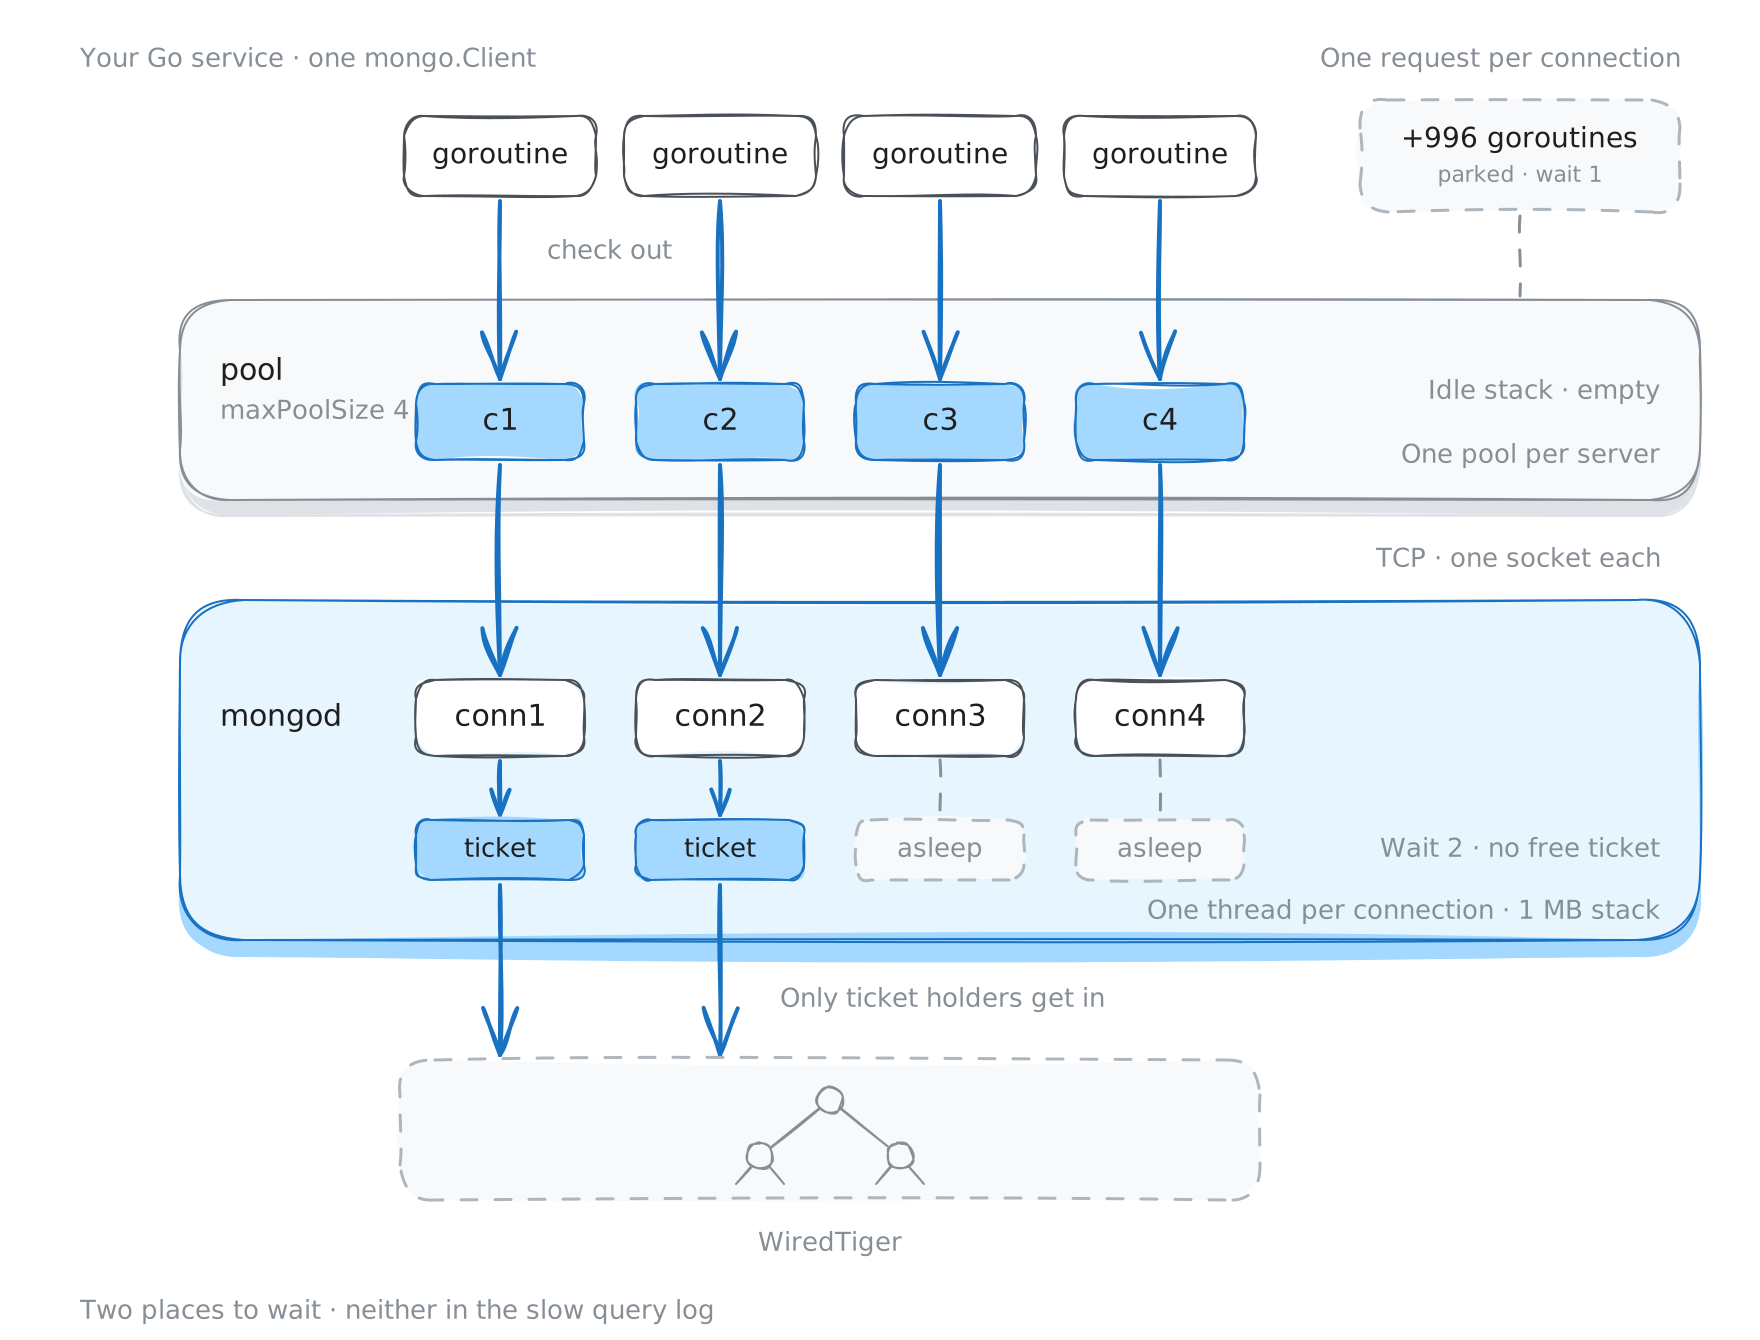
Here’s the trip in one paragraph. Your goroutine asks the driver for a connection. The driver writes the command onto it. Inside mongod, a thread that exists only for that connection reads the command, then asks for permission to run, a ticket. With a ticket it does the work in WiredTiger, gives the ticket back, and writes the reply on the same socket. The driver reads the reply, puts the connection back in the pool, and your goroutine carries on.
Two of those steps involve waiting: getting a connection, and getting a ticket. The first wait happens inside your service. The second happens inside mongod. Neither shows up in a slow query log, and on a bad day they’re where nearly all of your latency goes.
The first wait: inside your own process#
There’s no async here#
The Go driver doesn’t have an async API. When you call Find, your goroutine blocks until the reply comes back. Ten queries in flight means ten goroutines.
It also helps to know that a MongoDB connection carries one request at a time. The server handles one operation per connection, and the driver never sends a second request down a connection that’s still waiting for its first reply. So the number of requests your service can have in flight to a server is exactly the number of connections it has open to it.
Each mongo.Client keeps one pool per server it talks to, capped at maxPoolSize (100 by default). If you read from secondaries, each of them gets its own pool too. On top of that, the client keeps up to two monitoring connections to every server: one that watches for topology changes, and one that measures round-trip time. Those two don’t count against maxPoolSize, which is worth remembering the next time the connection count on the server doesn’t match your arithmetic.
What happens when you ask for a connection#
The code lives in pool.go, and it’s more interesting than I expected. It borrows a pattern from net/http: every goroutine that needs a connection creates a small “I want a connection” request object, and the pool works out who gets what.
First the pool checks for an idle connection. Idle connections sit on a stack, so you get the one that was returned most recently. Any that have been idle too long, or that belong to a pool that has since been reset, get thrown away on the way.
If nothing is idle, your goroutine joins two queues at the same time. One is for a connection that another goroutine is about to return. The other is for a brand-new connection, which the pool opens in the background as long as it’s still under maxPoolSize, and never more than maxConnecting (2 by default) at once. Your goroutine then goes to sleep until one of two things happens: a connection arrives from either queue, or its context runs out. Whichever connection shows up first wins.
When a goroutine finishes its query, the pool doesn’t just put the connection back on the shelf. It hands it straight to whoever has been waiting longest. Only when nobody is waiting does it go back on the stack.
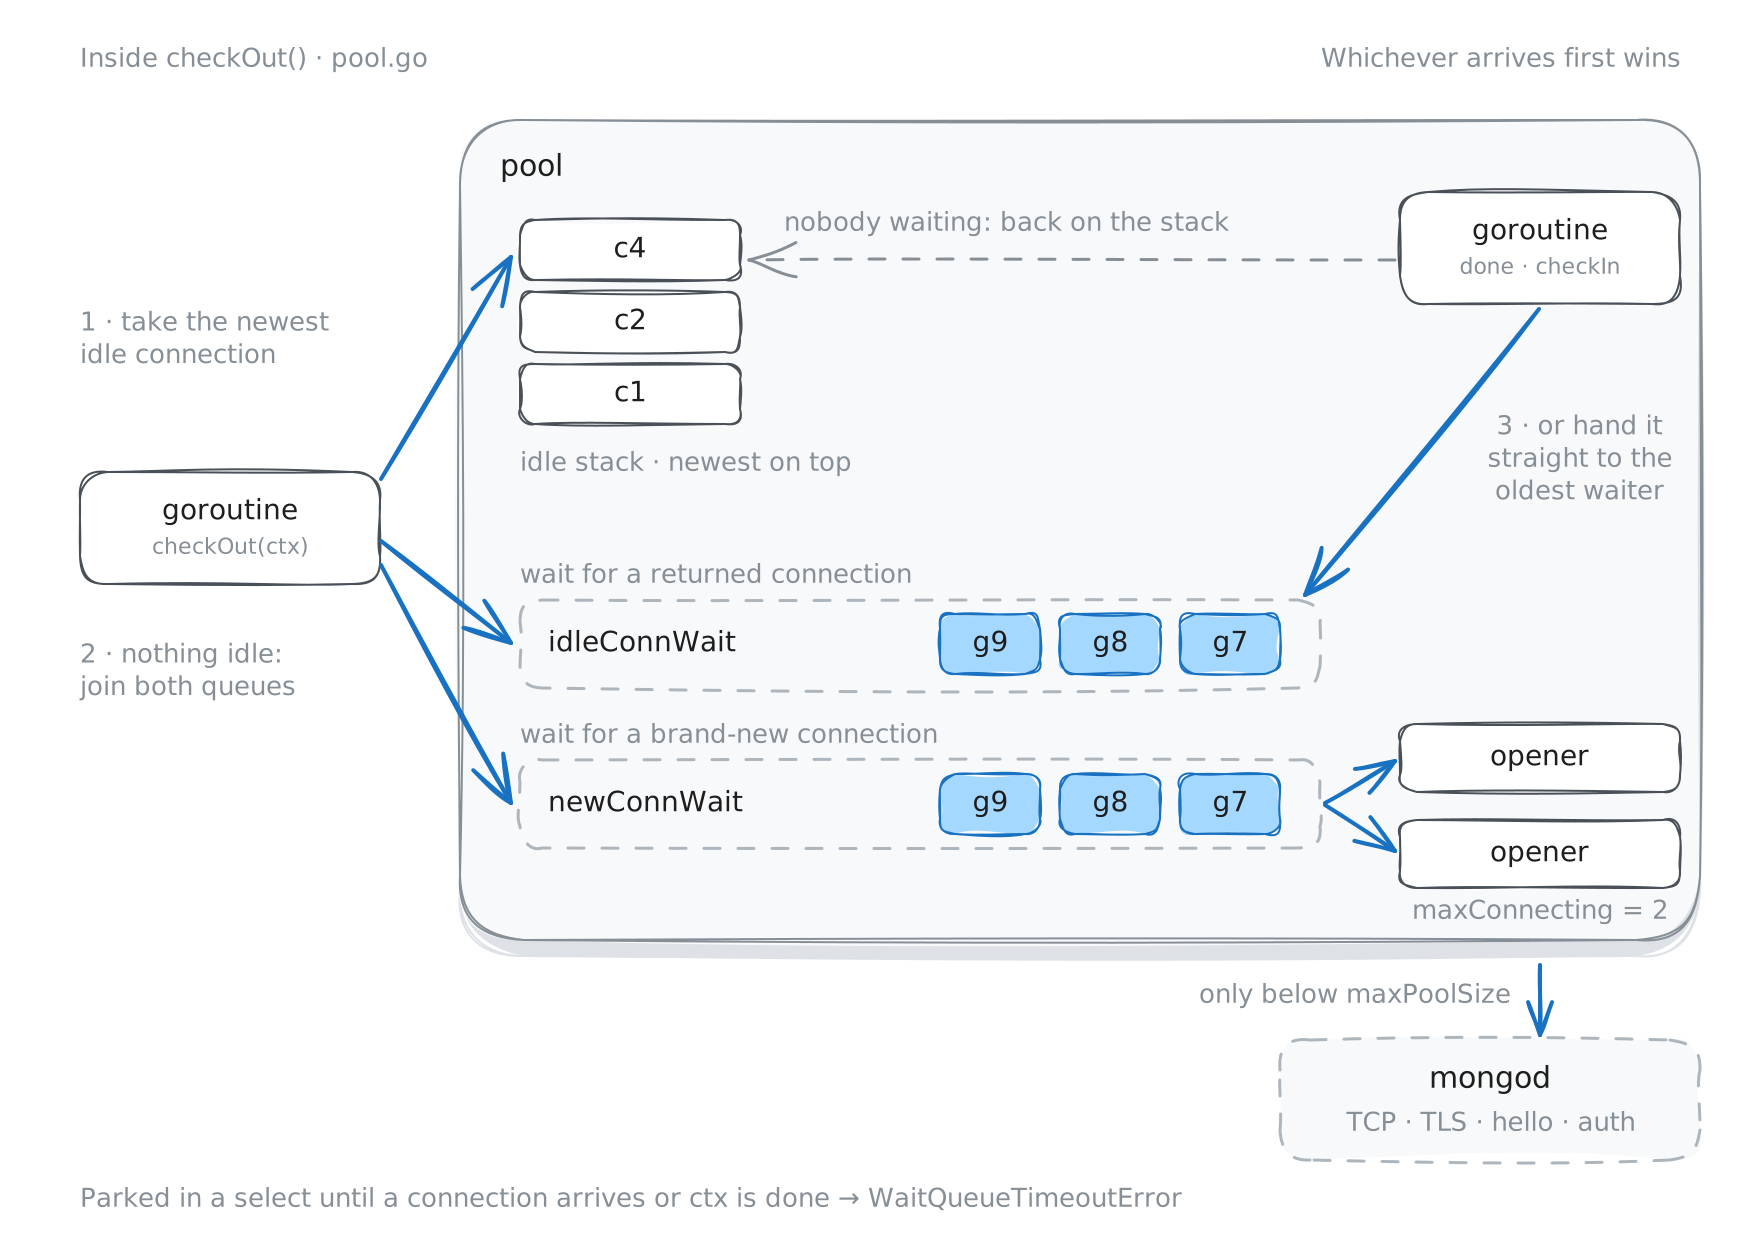
checkOut(): the newest idle connection if there is one, otherwise two queues and whichever delivers first.So there’s no buffer of pending requests anywhere in the driver. The queue is just your goroutines, asleep. A service with 1,000 goroutines and a pool of 10 has 990 goroutines parked, each costing a few kilobytes. That’s cheap in Go, which is exactly why it’s so easy not to notice.
Two side effects are worth knowing about. Because connections open lazily, a burst of traffic on a pool that isn’t full yet doesn’t wait for busy connections; it opens new ones, two at a time. And because idle connections come off a stack, a handful of recently used connections end up serving most of your traffic while the rest age out. If you see far fewer open connections than maxPoolSize under steady load, nothing is wrong.
How long can a goroutine sleep?#
As long as its context lets it. There’s no separate pool timeout. The wait ends when your ctx deadline passes, when the client’s Timeout runs out if you’ve set one, or after serverSelectionTimeout, 30 seconds by default, which the driver wraps around both choosing a server and checking out a connection (operation.go).
So if you pass context.Background() and set nothing else, a goroutine can wait up to 30 seconds for a connection. When the deadline does hit, you get a WaitQueueTimeoutError, which tells you the pool’s size, how many connections were open, how many were free, and how long you waited. It’s one of the more useful errors the driver gives you, so log all of it.
Here’s what that looks like. I sent 1,000 requests at once to a client with a pool of 10. Each request was a collection scan that takes about 30 ms on the server.
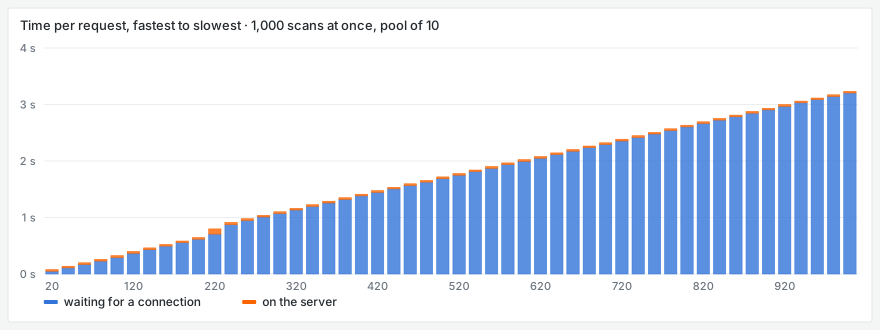
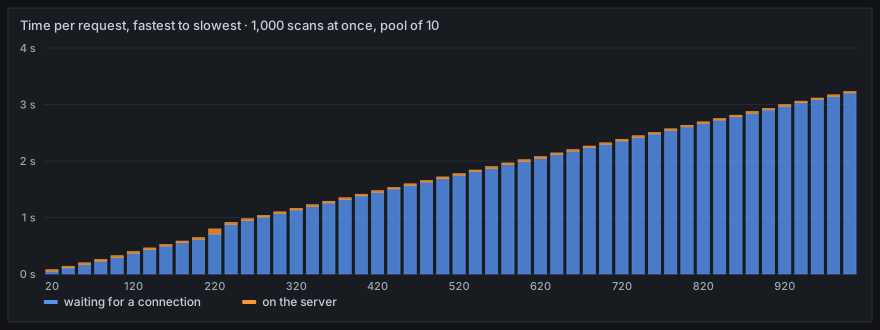
The median request waited 1.7 seconds for a connection and spent 30 ms on the server. The slowest waited 3.2 seconds. Nothing was slow inside MongoDB. The pool was ten wide, and 990 goroutines were asleep behind it. At its default 100 ms threshold, mongod’s slow query log would have caught 9 of the 1,000, because from mongod’s side a typical request took 30 ms.
Inside mongod: a thread for every connection#
Somebody is always listening#
When a connection arrives, mongod accepts it and gives it a thread of its own. That thread runs a loop that couldn’t be simpler: wait for a request, handle it, send the reply, wait again. The server’s transport README spells out that each connection has at most one request in progress, which is the server’s side of the one-request-per-connection rule. If you’ve seen conn1234 in mongod’s logs, that’s one of these threads.
The thread is an ordinary operating system thread with a 1 MB stack (service_executor_utils.cpp). There’s no clever shared worker pool and no special CPU pinning. MongoDB did try sharing: version 3.6 shipped an “adaptive” executor that ran many connections on a few threads, the way nginx does. It was deprecated in 4.4 and removed in 5.0. Thread-per-connection won.
Keeping a connection is cheap#
An idle connection’s thread is asleep, waiting for bytes that haven’t arrived yet. It uses no CPU at all.
It does use memory (up to that 1 MB of stack, though usually much less of it is actually touched), a file descriptor, and a slot in the operating system’s thread limit. Those limits are worth checking on your database hosts, but none of them costs CPU.
To check, I held 0, 500 and 2,000 idle connections open against the two-core mongod for 30 seconds each, with no traffic at all.
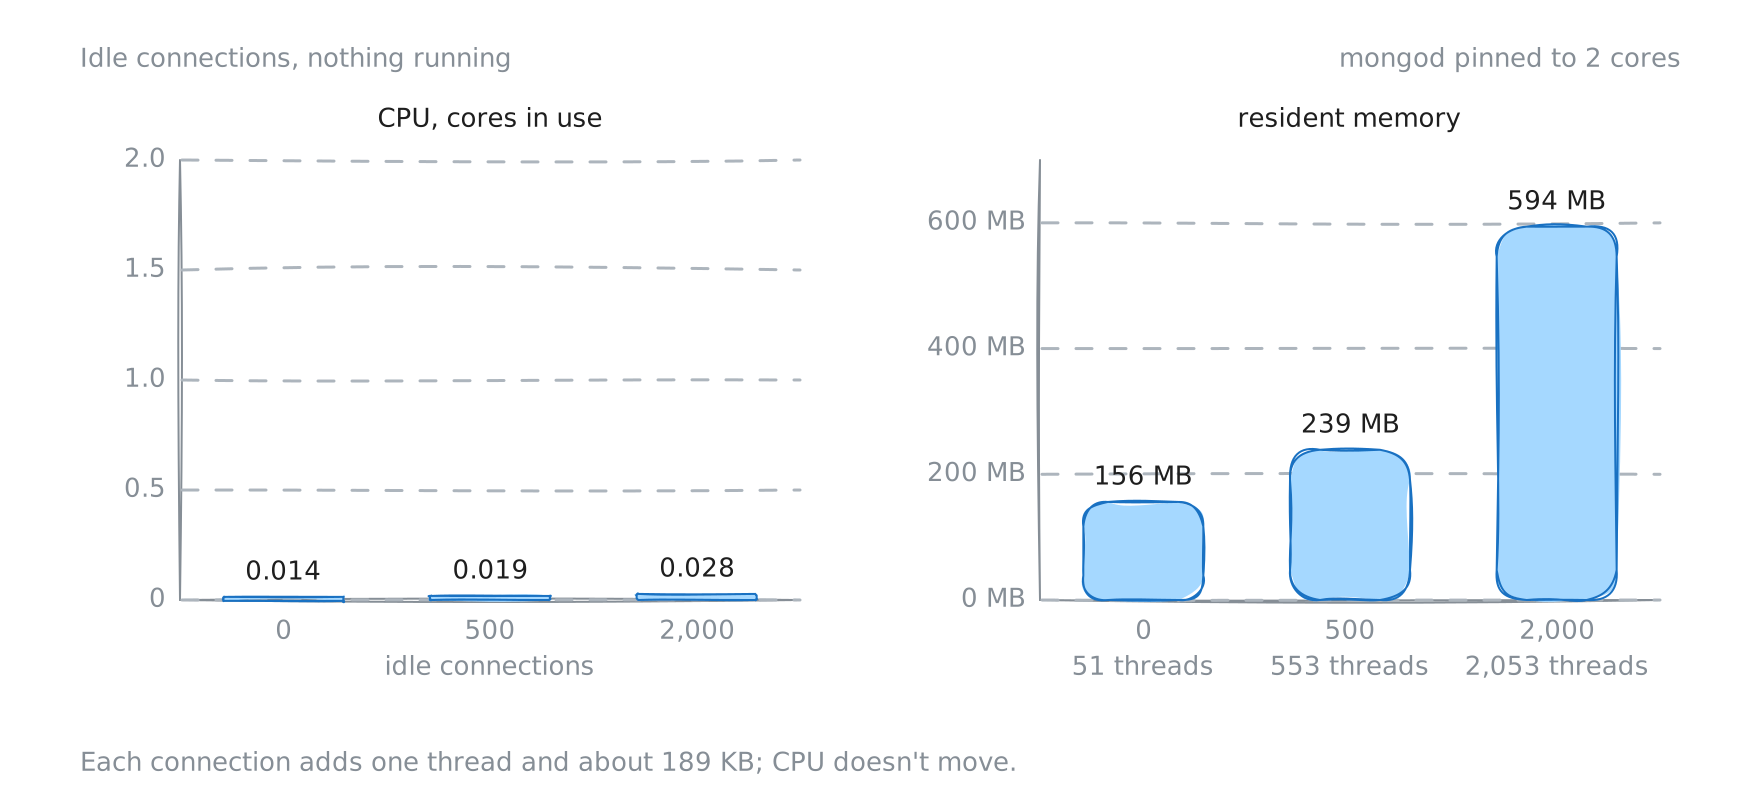
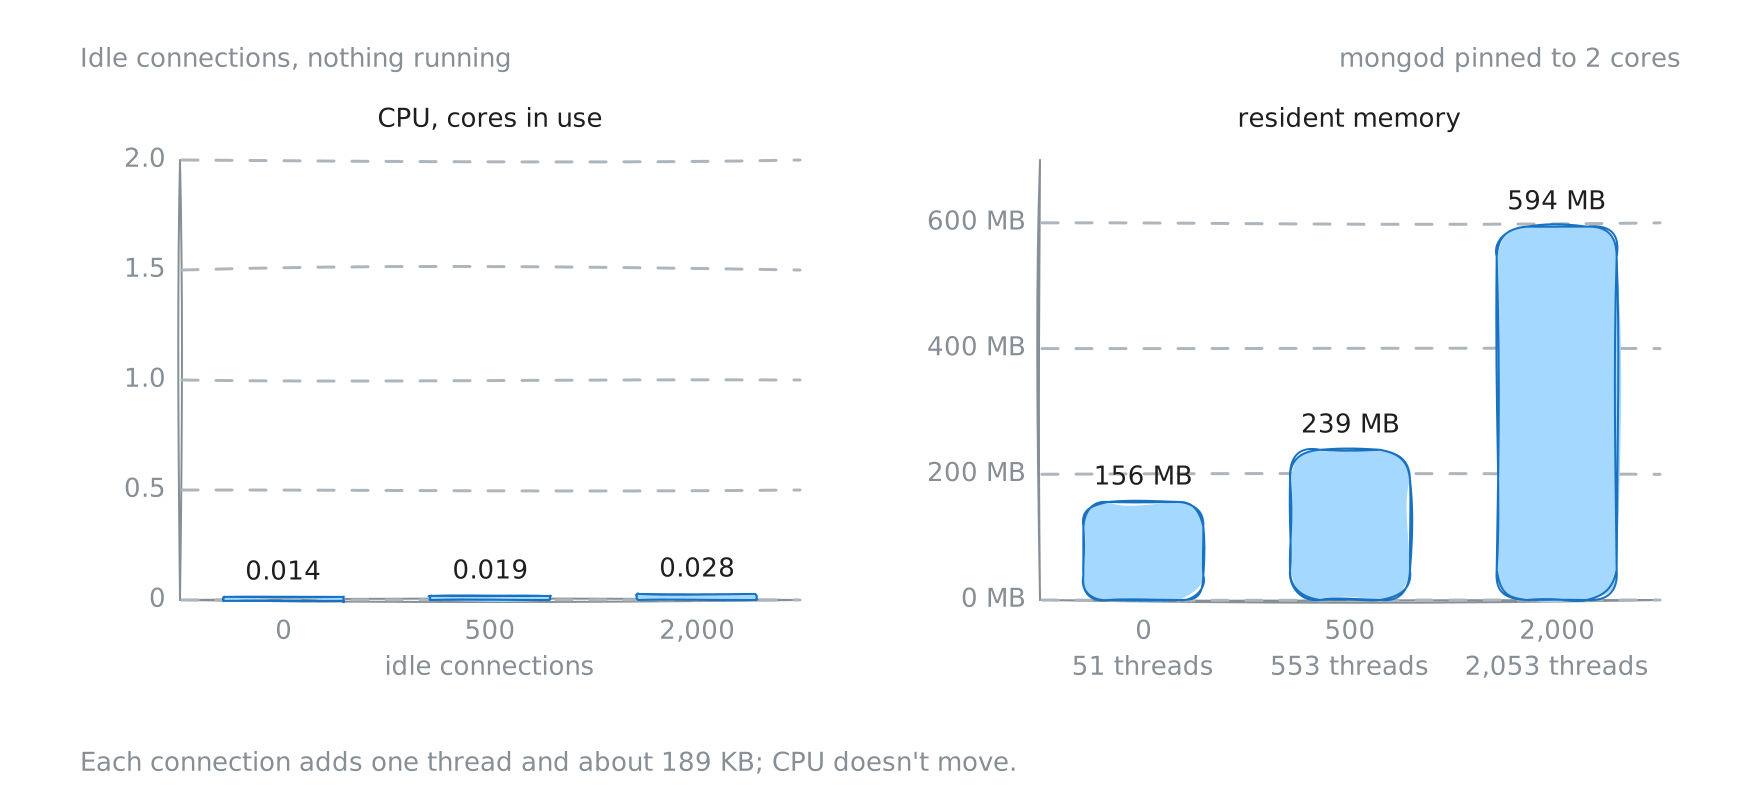
CPU went from 0.014 of a core to 0.028, which is noise. Memory went from 156 MB to 594 MB, about 190 KB per connection, and every connection added exactly one thread: 2,053 of them at 2,000 connections.
Opening one is not#
A new connection has a lot to get through before it can carry a single query: a TCP handshake, a TLS handshake if you use TLS, a hello exchange where the driver introduces itself, authentication, and finally a new thread on the server.
I went into this assuming authentication would be the expensive part. SCRAM-SHA-256 is deliberately slow; by default it runs the password through 15,000 rounds of hashing (scramSHA256IterationCount). But reading RFC 5802 set me straight: that slow hashing happens on the client, and the driver caches the result. The server only checks a proof, which takes a few cheap hash operations. On the server side, the TLS handshake is the most likely place for real CPU to go.
Which of these actually matters is something to measure, not guess. So I sent the same 200 point lookups a second twice: once on warm connections, and once with an idle limit so short that every request had to open a brand-new connection. The difference in mongod’s CPU is the price of opening one. Then I did the same with TLS on.
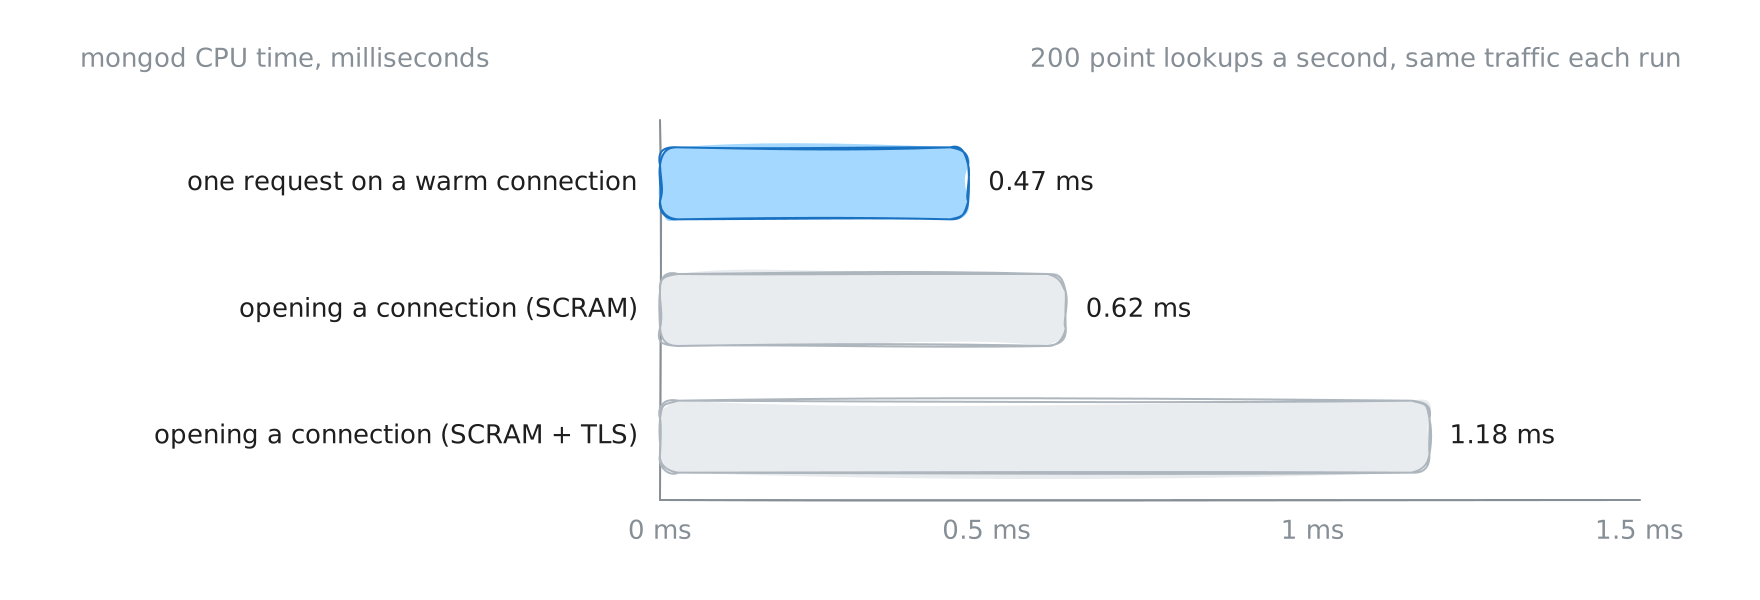
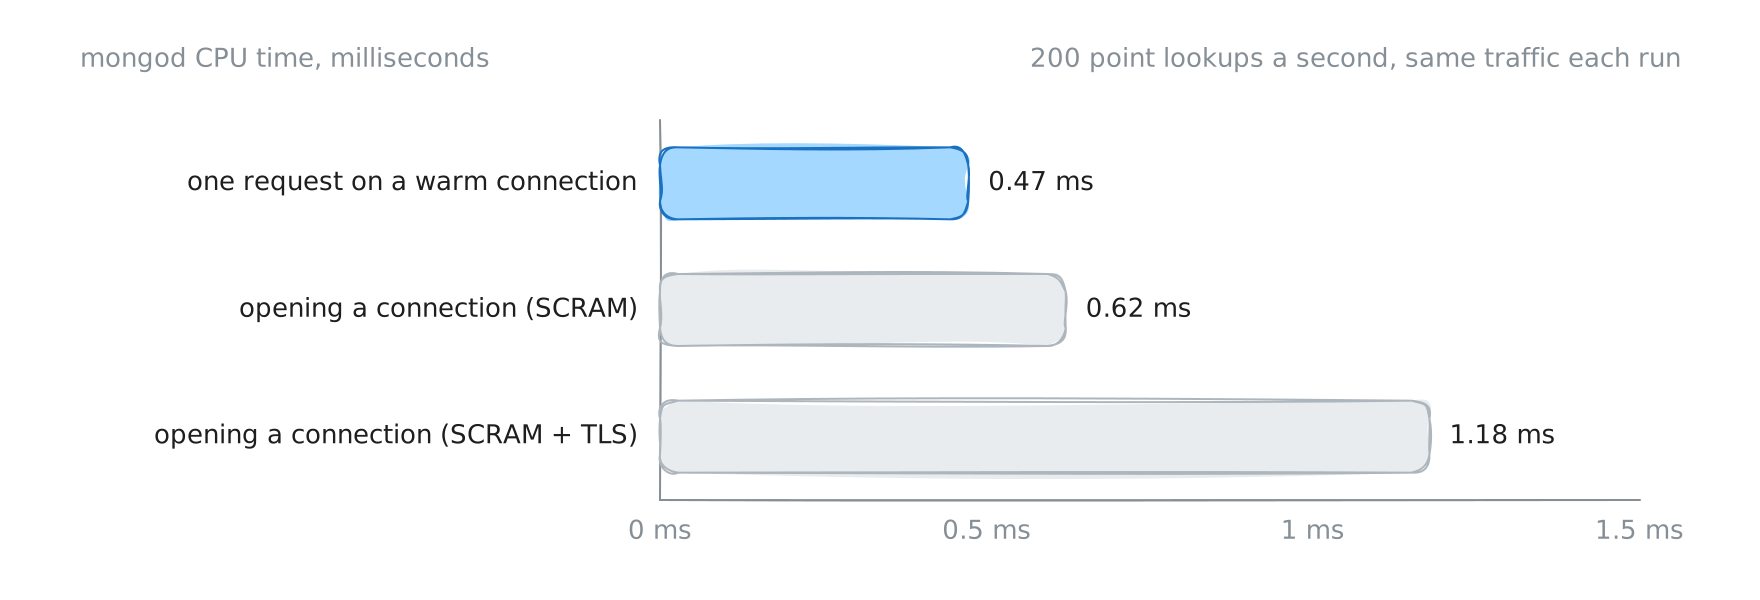
Opening a connection cost mongod 0.62 ms of CPU with SCRAM, and 1.18 ms with TLS as well, against 0.47 ms for the lookup itself. So the server side of SCRAM really is cheap, and TLS roughly doubles the price. Neither is dramatic. On two cores, it would take about 1,700 new TLS connections a second to keep mongod busy with handshakes alone. Churn hurts, but on its own it’s rarely what pins a CPU.
The second wait: tickets#
Permission to run#
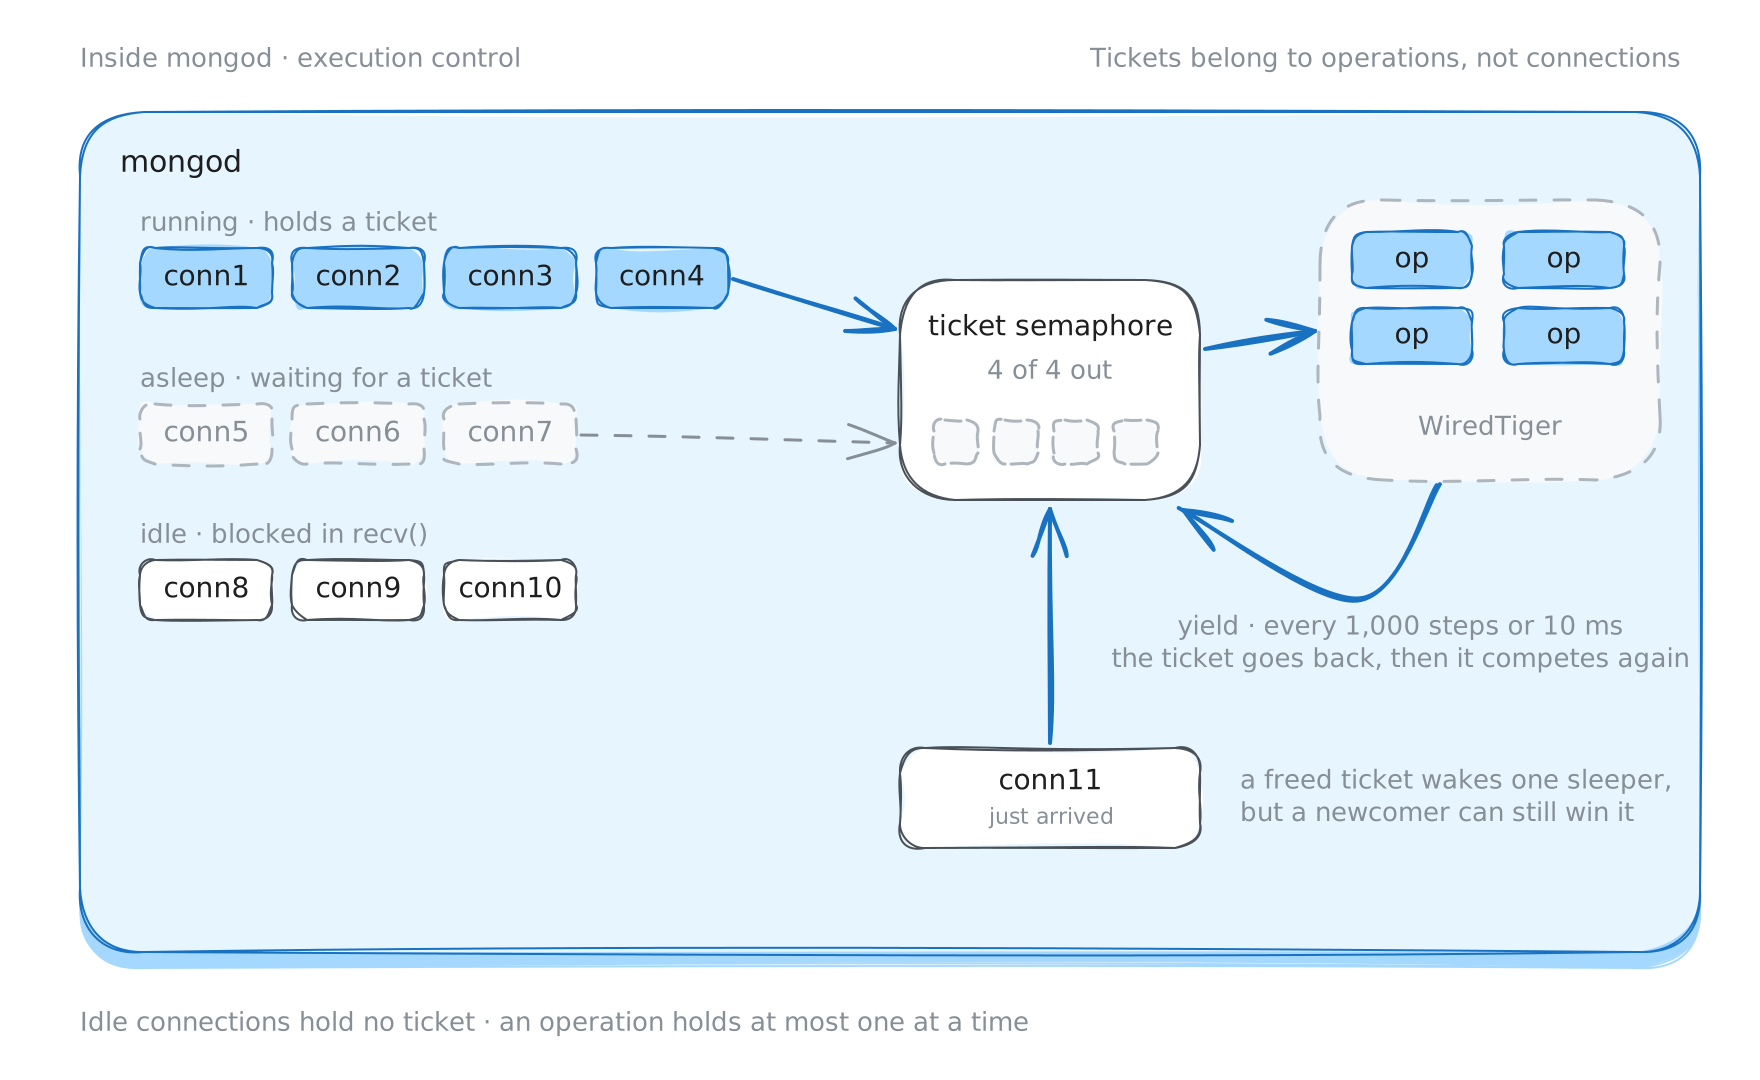
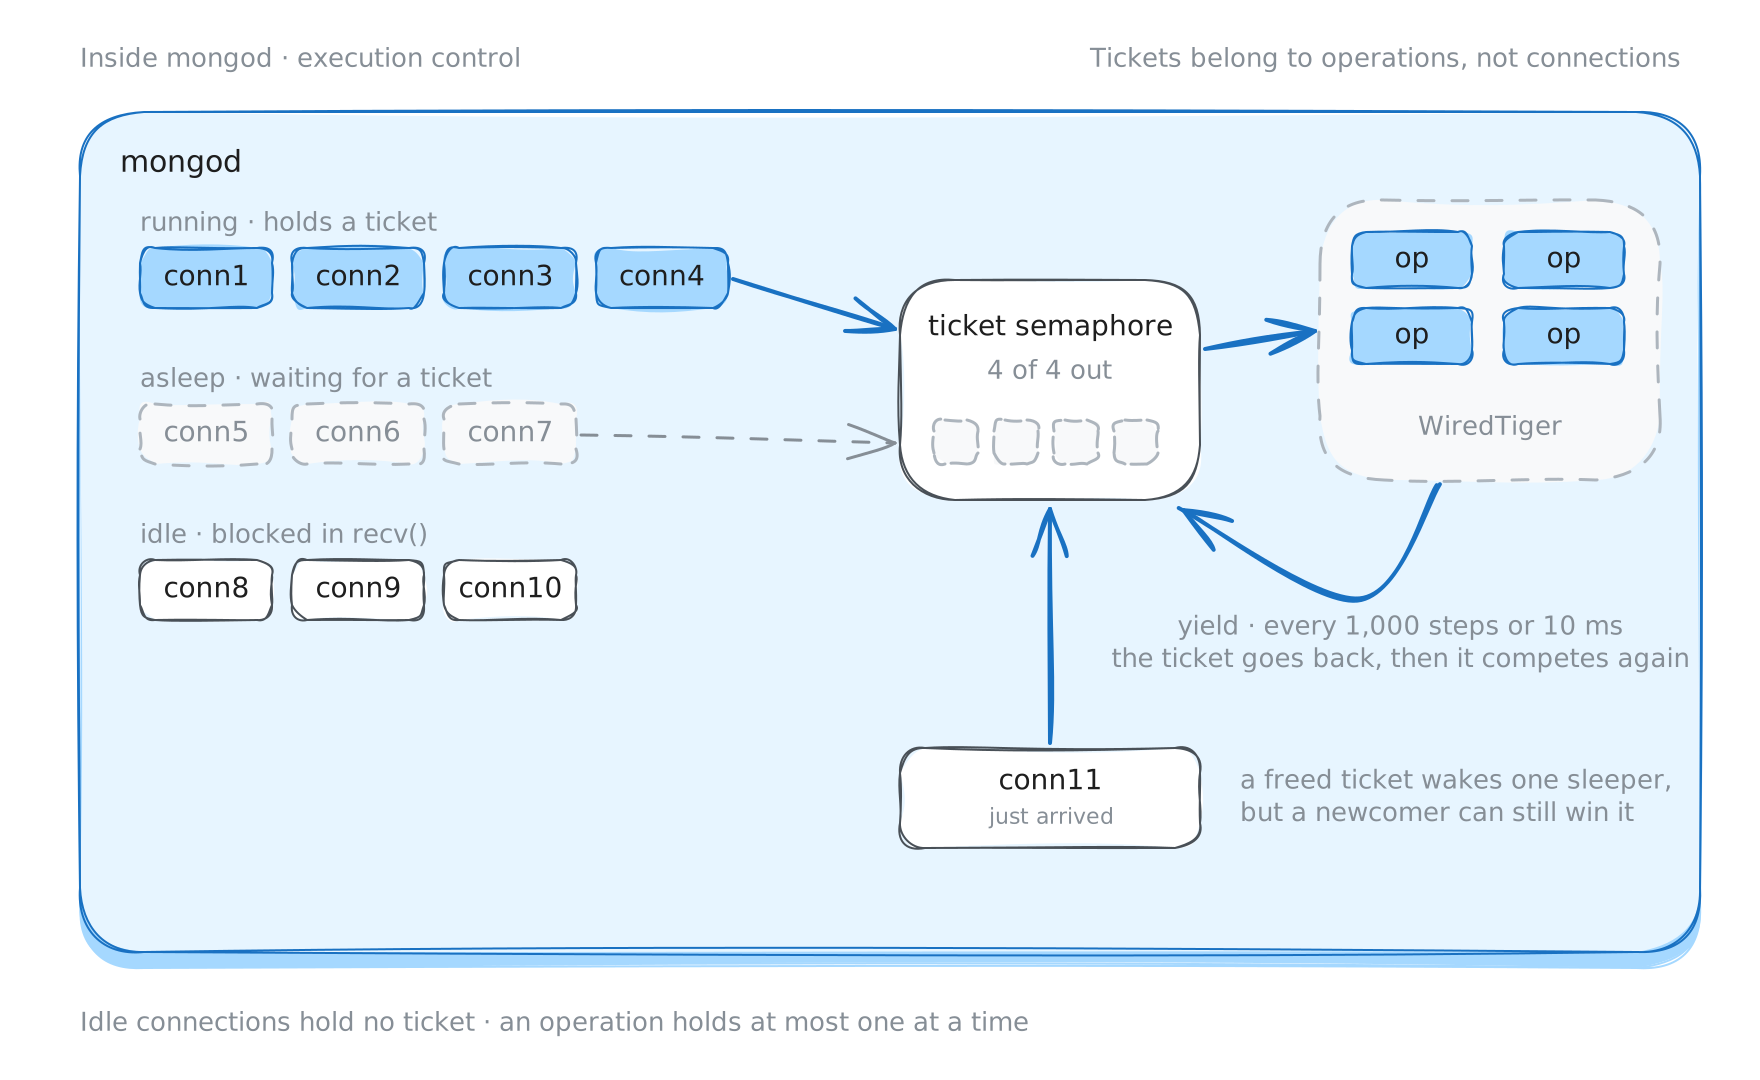
Having a thread doesn’t mean your request gets to run. Before it can touch the storage engine, it needs a ticket. Think of tickets as a fixed number of permits. Reads (finds, aggregations, counts) take one from a read pool. Writes (inserts, updates, deletes) take one from a write pool. When the pool is empty, the request waits.
Three details make this click:
Tickets belong to operations, not connections. A connection that’s sitting idle holds no ticket. That’s how a server can have 20,000 open connections and only 128 tickets without anything being wrong.
Nobody hands out the tickets. There’s no scheduler looking across connections and picking the next request to run. The connection’s own thread, the one that read the request, asks for a ticket. If none is free, that thread goes to sleep. When it wakes up holding a ticket, it runs the request and writes the reply itself.
The line isn’t fair. Your driver queues goroutines first come, first served. mongod doesn’t. In 8.0, giving a ticket back wakes one sleeping thread, and that thread has to compete with whatever request happens to arrive at the same moment (semaphore_ticketholder.cpp). The newer server source is blunt about it: its ticket semaphore offers “no fairness guarantee”. A request that just arrived can get in ahead of one that has been waiting.
Long queries take turns#
A query that scans a collection for 30 seconds doesn’t hold a ticket for 30 seconds. MongoDB runs a query as a tree of steps, the IXSCAN, FETCH and COLLSCAN you see in explain, and moves it forward a little at a time: examine one index key, fetch one document, and so on.
Every 1,000 of those small steps, or every 10 milliseconds, whichever comes first, the query yields. It remembers where it was, gives back its locks and its ticket, and gets back in line for a new ticket like everyone else. A lookup by _id is done long before it would ever need to yield, so it takes a ticket once and gives it back.
Why 128 tickets is plenty#
You’d think a busy database would need more than 128 tickets per pool. It almost never does.
Since 7.0, mongod picks the number for you with an algorithm called throughput probing. In 8.0 it starts with as many tickets as the machine has CPU cores, tries a little more and a little less, and keeps whichever setting gets more done. It never goes below 4 or above 128 per pool.
If you run mongod in a container, it counts the host’s cores, not yours. Pinned to two CPUs in Docker on a 12-core laptop, mine started with 12 read and 12 write tickets, while hostInfo reported 2 cores available to the process.
The arithmetic is what convinced me. If a typical operation holds its ticket for one millisecond:
128 tickets / 1 ms each ≈ 128,000 operations per secondOn a 16-core machine, at most 16 of those 128 can be on a CPU at any moment. The rest are waiting for the disk, for the cache to make room, or for another write to get out of the way. Add more tickets past that and you mostly add contention inside the storage engine, which makes everything slower.
So when you run out of tickets, it’s almost never because there are too few. It’s because each operation is holding its ticket for longer, usually thanks to a missing index, a slow disk, or a cache under pressure.
You can switch off the automatic adjustment and fix the counts yourself (storageEngineConcurrencyAdjustmentAlgorithm: "fixedConcurrentTransactions", then storageEngineConcurrentReadTransactions and ...WriteTransactions). In 8.0 the algorithm can only be set at startup, the smallest fixed count it accepts is 5, and MongoDB’s documentation asks you to talk to their support first.
I tried it anyway, against probing, with the same 260 scans a second on two cores.
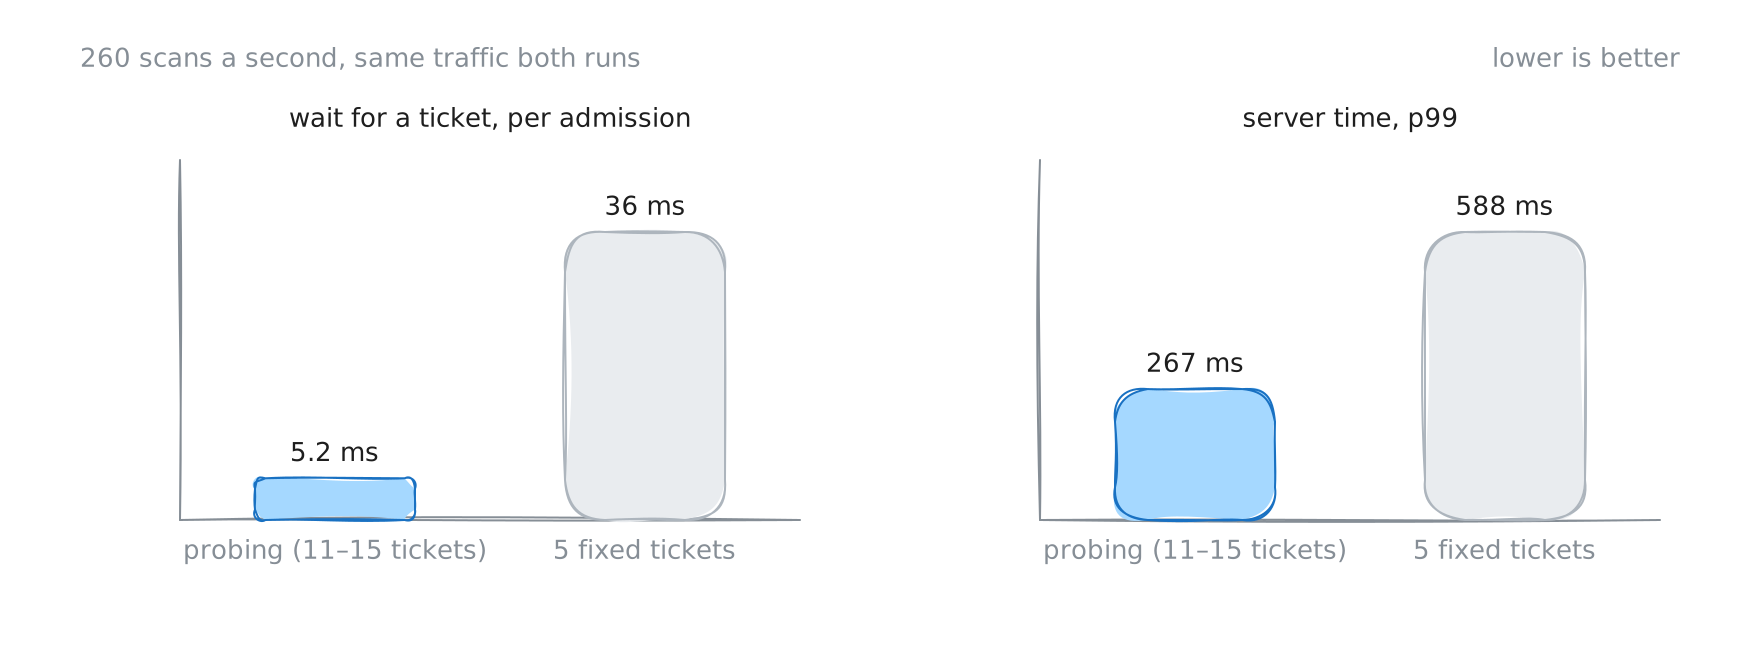
Probing settled between 11 and 15 tickets. Five fixed tickets made each admission wait 36 ms instead of 5, and pushed server-side p99 from 267 ms to 588 ms. Both handled all 260 scans a second. Fewer tickets didn’t protect anything here; they just made the line in front of the gate longer.
Transactions keep their place in line#
Multi-document transactions bend both of those rules, and the reasons are right there in the source.
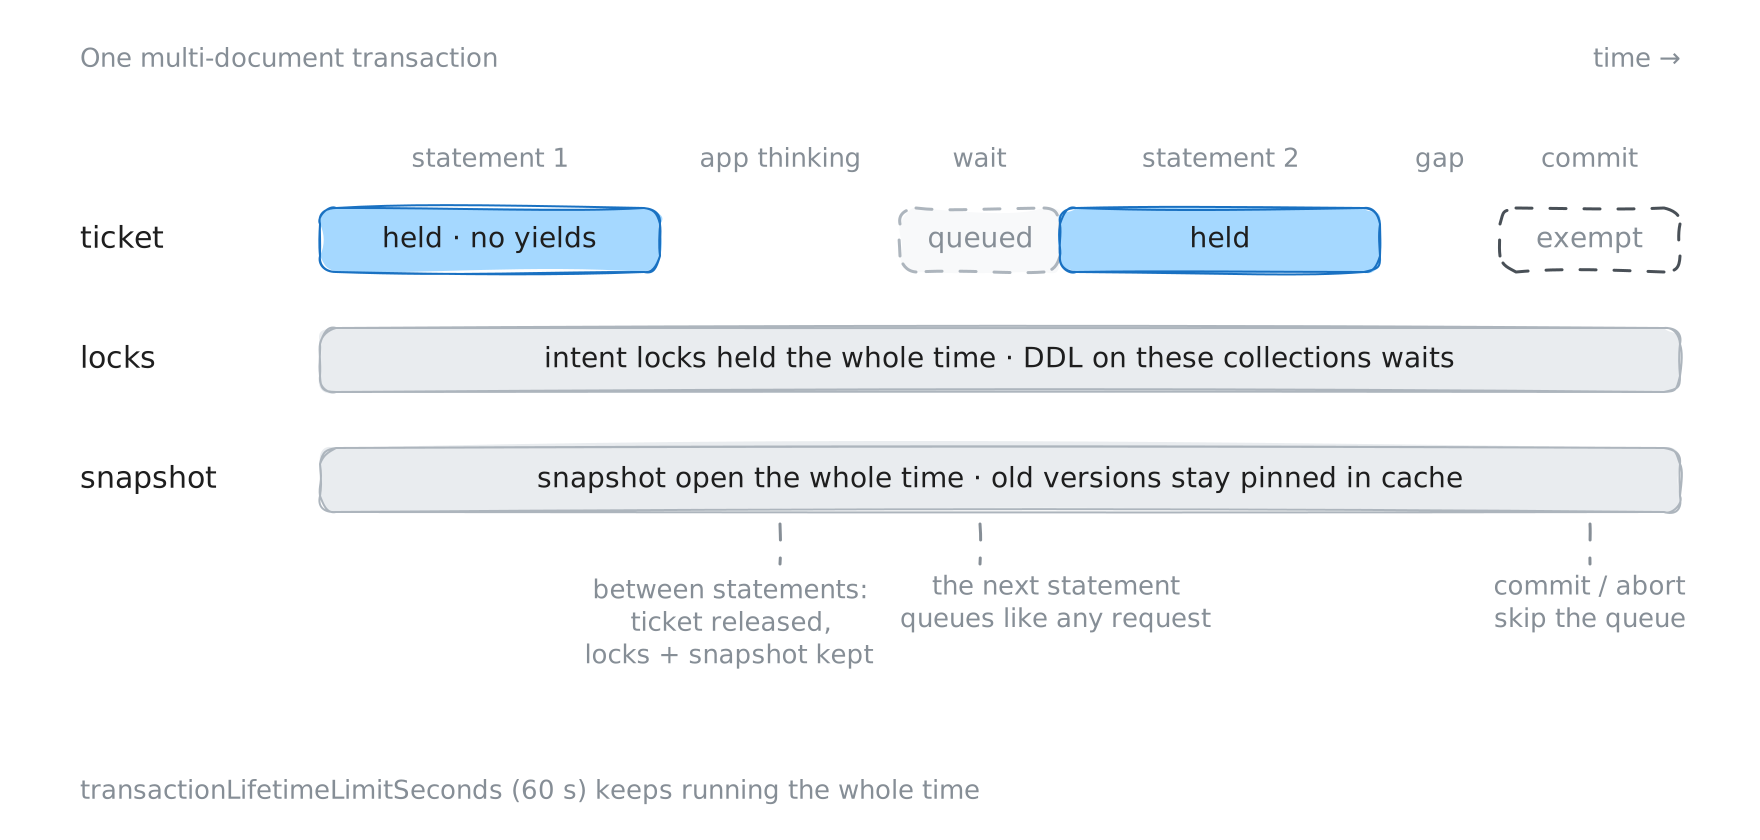
A statement inside a transaction never yields. A transaction has to read everything from one consistent snapshot, so mongod can’t let a statement drop its snapshot halfway through (plan_yield_policy.cpp). A heavy update inside a transaction keeps its ticket from the first document to the last.
Between statements, the transaction gives up its ticket but nothing else. When a statement finishes, mongod puts the transaction’s state aside and releases the ticket (transaction_participant.cpp). Its locks and its snapshot stay exactly where they were. The next statement has to queue for a ticket like any other request, and while it waits:
- the transaction’s 60-second lifetime keeps ticking;
- its locks keep blocking things like
createIndexon the collections it touched; - its open snapshot keeps old versions of documents in the cache, which makes everyone else a little slower, which makes them hold their tickets a little longer.
Commit and abort don’t queue at all. They only give resources back, and the source notes that making them wait could deadlock against requests that are holding write tickets while waiting for the transaction’s locks.
Two waits, one number on your dashboard#
From your service’s point of view, a request’s latency is:
waiting for a connection + waiting for a ticket + doing the workThe first two trade off against each other. With a small pool, requests wait in your service, where waiting is a sleeping goroutine. With a large pool, the same requests wait inside mongod, where each one costs a server thread and some memory, and where the line isn’t fair. Neither setting changes how fast the server can actually do the work.
Picture five ECS tasks, each with a pool of five connections. mongod can have at most 25 requests in flight from them. If 10 tickets are free, 10 run and up to 15 sleep at the gate. No client ever checks whether it’s next. From the driver’s side, a request waiting for a ticket looks exactly like a slow query.
To watch the trade-off, I fixed mongod at 5 tickets, sent scans at 95% of what two cores can do, and changed only maxPoolSize, from 2 to 64. Each size ran for a minute, twice.
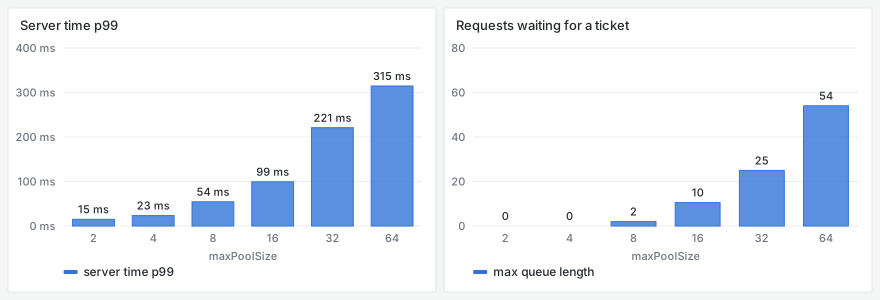
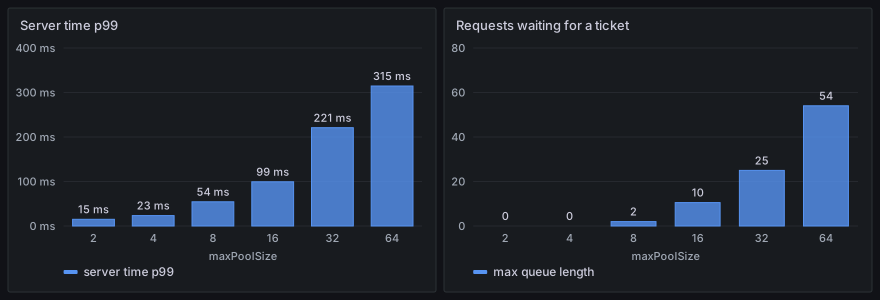
Throughput didn’t move: 268 completed requests a second at every size from 4 up. A pool of 2 couldn’t quite keep up, and its queue in the driver reached seconds. What changed was where requests waited. Server-side p99 went from 15 ms with a pool of 2 to 315 ms with 64, and the line for tickets from nothing to 54 requests. The wait for a connection went the other way, from over a second at 2 to a couple of milliseconds at 64. In between it jumped around from run to run, which is why the chart shows the server side.
From mongod’s point of view, the bigger pool looks exactly like slower queries.
Here’s the same trade-off as a simulation you can play with. It’s a simple model rather than the lab: one client, a mongod with 2 cores, every request needing 7 ms of CPU, and tickets handed out in no particular order. Dots in the first column are goroutines waiting for a connection, and dots in the third are connection threads waiting for a ticket. It leaves deadlines out; the incident below covers those with real measurements.
Set the traffic near 100% and slide maxPoolSize from small to large. Throughput stays put, and the dots move from the first column to the third.
Back to the incident#
Our services ran with maxPoolSize 100 and minPoolSize 10, closed connections after 10 idle minutes, and their callers gave each request 100 ms. The fix raised minPoolSize to 30.
I rebuilt that shape in the lab: eight instances, each with its own mongo.Client and those pool settings, and a 100 ms deadline on every request. They sent half of what mongod could handle, about 4,400 small lookups a second on two cores, then 130% of it for 15 seconds, then half again. I ran it with minPoolSize 10, with 30, and for contrast with each instance capped at 4 connections. Three runs of each.
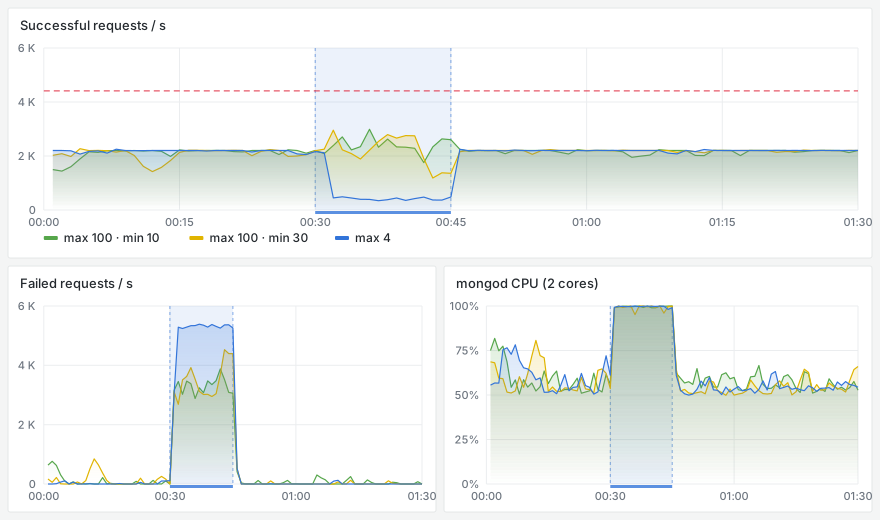
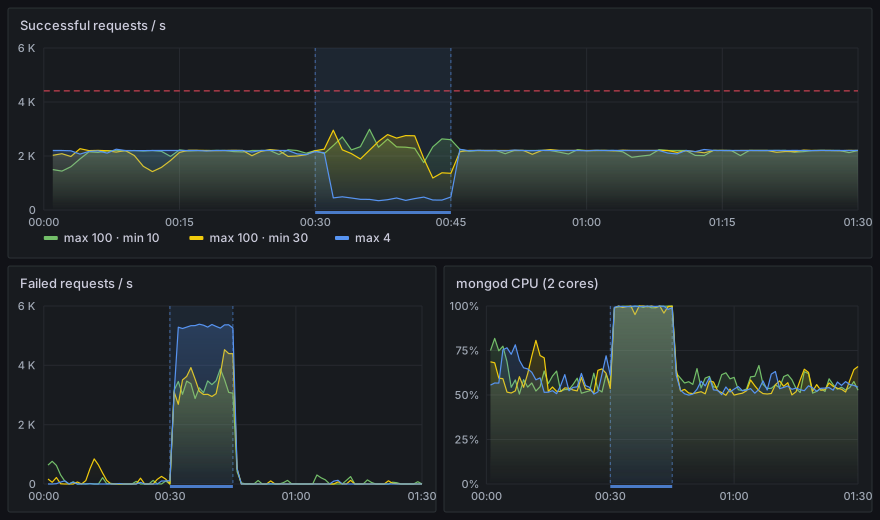
The burst reproduced what we saw. In every configuration mongod went to 100% CPU, and successful requests dropped to about half of what it could do: around 2,200 to 2,400 a second against a capacity of 4,400. The rest failed, about 3,200 a second, and almost all of those had already been sent. That’s the part that hurts. A request that times out after it’s sent keeps running inside mongod. The caller has stopped waiting, but the server hasn’t, so a large share of that 100% CPU went on answers nobody was listening for any more.
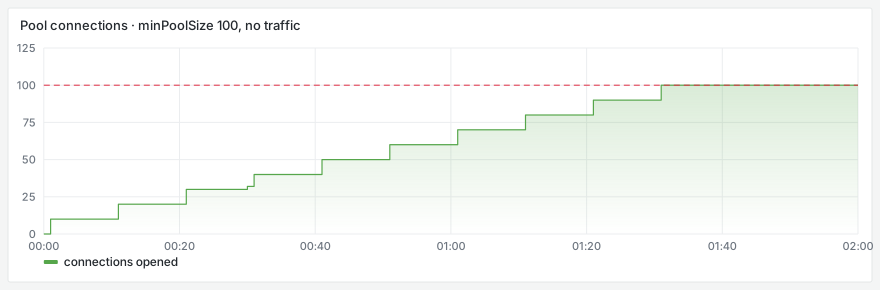
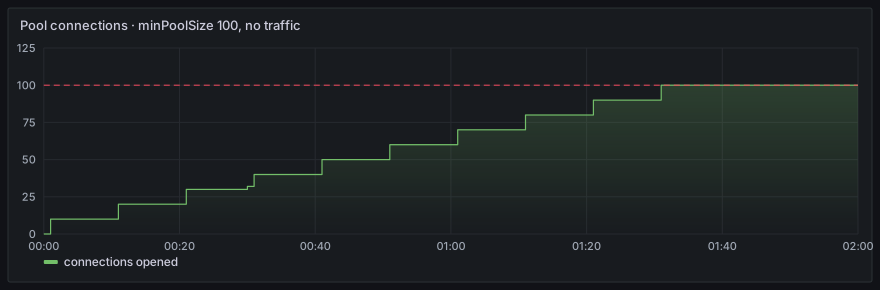
Raising minPoolSize didn’t change it. With 10 or with 30 the burst looked the same, within the noise between runs, and both recovered within a few seconds of it ending. It isn’t hard to see why. During an overload the queue is inside mongod, and a pool’s minimum only decides how many connections are already open before traffic arrives. It doesn’t even do that quickly: the driver tops minPoolSize up by at most 10 connections every 10 seconds, so a pool with a minimum of 30 starts out with 10.
A small pool made it worse, not better. I expected capping each instance at 4 connections to help, since a request that times out while it’s still waiting for a connection never reaches mongod and costs it nothing. Instead, successful requests fell to about 530 a second. The requests that queued in the driver spent most of their 100 ms there, then were sent anyway with almost no time left, timed out on the server, and cost it the full price. The ones that did succeed took a median of 98 ms. Waiting in the driver doesn’t spare the server. It just uses up the deadline before the request gets there.
So I can’t honestly say that minPoolSize 30 is what fixed our incident. What the lab does support is narrower. Idle connections cost mongod no CPU, so the small rise in steady CPU after our change wasn’t the price of holding more of them. And no pool setting adds capacity. The pool decides where requests wait, and the deadline decides how much of that waiting the server ends up paying for.
What I’d set#
| Setting | What I’d do | Why |
|---|---|---|
mongo.Client | one per process, shared by every goroutine | each client brings its own pools and monitors |
| Deadlines | always set one, and set the client’s Timeout too | without one, a goroutine can wait 30 s for a connection. With Timeout, the driver also tells mongod how long it has (maxTimeMS), which I didn’t measure here |
minPoolSize | about what a normal minute needs | idle connections cost about 190 KB and a thread each, and no CPU. It fills 10 every 10 s, so don’t count on it right after a deploy |
maxPoolSize | size it against what mongod can run, across the whole fleet | bigger moves the queue into mongod, smaller spends the deadline in the driver. Neither adds throughput |
maxConnecting | leave it at 2 | it’s the driver’s built-in brake on storms |
appName | set it on every service | so the logs and $currentOp tell you who’s who |
| Pool metrics | export connection wait time and opens/closes from a PoolMonitor | otherwise the first queue is invisible |
| Headroom | keep it above your biggest bursts | past capacity, about half of mongod’s CPU went on requests nobody was waiting for |
How this was measured#
Everything above comes from mongo-pool-lab, and every number is in its results summary.
- mongod 8.0 in Docker, pinned to two CPUs with 2 GB of memory and auth on. A single node, not a replica set.
- The official Go driver, one
mongo.Clientper simulated service instance. - 50,000 documents of about 250 bytes, and three kinds of request: a lookup by
_id, a read of 1,000 documents through the_idindex, and a full collection scan. - Open-loop load. Requests go out on a fixed schedule whether or not earlier ones have finished, the way real traffic arrives. A fixed set of workers in a loop would slow down with the database and hide the queues.
- One machine. The load generator ran on the same laptop as mongod, outside its two CPUs, so the network between them is close to zero.
Each experiment is one command, and go run ./cmd/lab summary rebuilds the summary from the raw data.